
|
Valoración DCF de Donegal Group Inc. (DGICA) |
Completamente Editable: Adáptelo A Sus Necesidades En Excel O Sheets
Diseño Profesional: Plantillas Confiables Y Estándares De La Industria
Predeterminadas Para Un Uso Rápido Y Eficiente
Compatible con MAC / PC, completamente desbloqueado
No Se Necesita Experiencia; Fáciles De Seguir
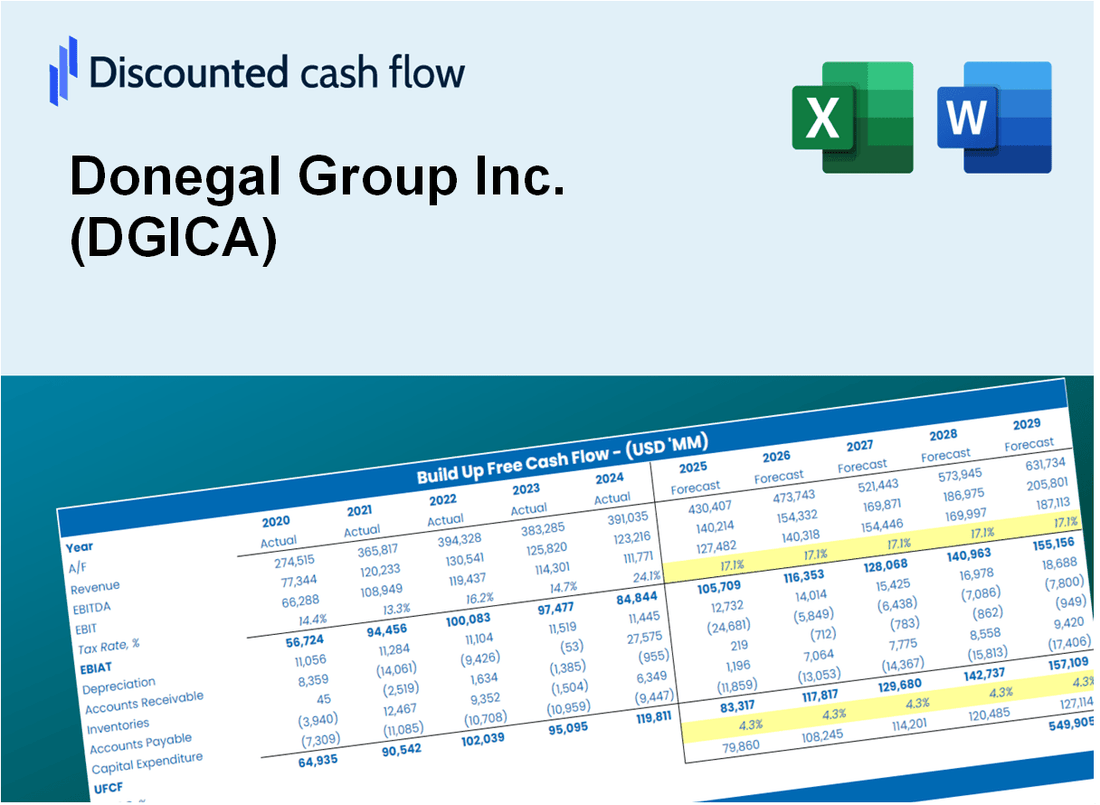
Donegal Group Inc. (DGICA) Bundle
¡Mejore sus opciones de inversión con la calculadora DCF de Donegal Group Inc. (DGICA)! Utilice datos financieros reales de Donegal, ajuste las proyecciones y gastos de crecimiento, y observe instantáneamente cómo estas modificaciones afectan el valor intrínseco de Donegal Group Inc. (DGICA).
Discounted Cash Flow (DCF) - (USD MM)
| Year | AY1 2020 |
AY2 2021 |
AY3 2022 |
AY4 2023 |
AY5 2024 |
FY1 2025 |
FY2 2026 |
FY3 2027 |
FY4 2028 |
FY5 2029 |
|---|---|---|---|---|---|---|---|---|---|---|
| Revenue | 777.8 | 816.5 | 848.2 | 927.3 | 989.6 | 1,051.2 | 1,116.6 | 1,186.2 | 1,260.0 | 1,338.4 |
| Revenue Growth, % | 0 | 4.97 | 3.89 | 9.33 | 6.71 | 6.22 | 6.22 | 6.22 | 6.22 | 6.22 |
| EBITDA | 71.2 | 37.1 | 1.8 | 10.0 | 67.2 | 45.8 | 48.6 | 51.7 | 54.9 | 58.3 |
| EBITDA, % | 9.15 | 4.54 | 0.21504 | 1.08 | 6.79 | 4.35 | 4.35 | 4.35 | 4.35 | 4.35 |
| Depreciation | 6.7 | 5.8 | 4.8 | 4.3 | 3.9 | 6.3 | 6.7 | 7.1 | 7.6 | 8.1 |
| Depreciation, % | 0.86416 | 0.71501 | 0.57079 | 0.46654 | 0.39138 | 0.60158 | 0.60158 | 0.60158 | 0.60158 | 0.60158 |
| EBIT | 64.5 | 31.2 | -3.0 | 5.7 | 63.3 | 39.5 | 41.9 | 44.5 | 47.3 | 50.2 |
| EBIT, % | 8.29 | 3.83 | -0.35575 | 0.61286 | 6.39 | 3.75 | 3.75 | 3.75 | 3.75 | 3.75 |
| Total Cash | 679.1 | 603.0 | 606.2 | 645.4 | 401.9 | 720.8 | 765.7 | 813.4 | 864.0 | 917.8 |
| Total Cash, percent | .0 | .0 | .0 | .0 | .0 | .0 | .0 | .0 | .0 | .0 |
| Account Receivables | 67.7 | 642.4 | 638.9 | 632.5 | 610.3 | 615.1 | 653.4 | 694.1 | 737.3 | 783.2 |
| Account Receivables, % | 8.7 | 78.68 | 75.32 | 68.21 | 61.67 | 58.52 | 58.52 | 58.52 | 58.52 | 58.52 |
| Inventories | .0 | .0 | .0 | .0 | .0 | .0 | .0 | .0 | .0 | .0 |
| Inventories, % | 0 | 0 | 0 | 0 | 0 | 0 | 0 | 0 | 0 | 0 |
| Accounts Payable | 3.2 | 3.9 | 3.5 | 8.8 | 4.3 | 5.7 | 6.0 | 6.4 | 6.8 | 7.2 |
| Accounts Payable, % | 0.41572 | 0.48332 | 0.41214 | 0.94453 | 0.43906 | 0.53895 | 0.53895 | 0.53895 | 0.53895 | 0.53895 |
| Capital Expenditure | -.1 | .0 | .0 | .0 | .0 | .0 | .0 | .0 | .0 | .0 |
| Capital Expenditure, % | -0.01153249 | 0 | 0 | -0.00482036 | 0 | -0.00327057 | -0.00327057 | -0.00327057 | -0.00327057 | -0.00327057 |
| Tax Rate, % | 18.41 | 18.41 | 18.41 | 18.41 | 18.41 | 18.41 | 18.41 | 18.41 | 18.41 | 18.41 |
| EBITAT | 53.8 | 26.0 | -1.6 | 5.0 | 51.6 | 30.7 | 32.7 | 34.7 | 36.8 | 39.1 |
| Depreciation | ||||||||||
| Changes in Account Receivables | ||||||||||
| Changes in Inventories | ||||||||||
| Changes in Accounts Payable | ||||||||||
| Capital Expenditure | ||||||||||
| UFCF | -4.0 | -542.2 | 6.3 | 20.9 | 73.3 | 33.5 | 1.4 | 1.5 | 1.6 | 1.7 |
| WACC, % | 4.61 | 4.6 | 4.55 | 4.61 | 4.6 | 4.59 | 4.59 | 4.59 | 4.59 | 4.59 |
| PV UFCF | ||||||||||
| SUM PV UFCF | 37.3 | |||||||||
| Long Term Growth Rate, % | 2.00 | |||||||||
| Free cash flow (T + 1) | 2 | |||||||||
| Terminal Value | 66 | |||||||||
| Present Terminal Value | 53 | |||||||||
| Enterprise Value | 90 | |||||||||
| Net Debt | -18 | |||||||||
| Equity Value | 108 | |||||||||
| Diluted Shares Outstanding, MM | 33 | |||||||||
| Equity Value Per Share | 3.26 |
What You Will Get
- Editable Forecast Inputs: Easily modify assumptions (growth %, margins, WACC) to explore various scenarios.
- Real-World Data: Donegal Group Inc.'s (DGICA) financial data pre-loaded to facilitate your analysis.
- Automatic DCF Outputs: The template computes Net Present Value (NPV) and intrinsic value automatically.
- Customizable and Professional: A refined Excel model that adjusts to your valuation requirements.
- Built for Analysts and Investors: Perfect for testing forecasts, validating strategies, and enhancing efficiency.
Key Features
- Customizable Financial Inputs: Adjust essential factors such as premium growth, loss ratios, and expense ratios.
- Instant DCF Valuation: Automatically computes intrinsic value, NPV, and other financial metrics in real-time.
- Industry-Leading Precision: Leverages Donegal Group Inc.'s (DGICA) actual financial data for accurate valuation results.
- Effortless Scenario Analysis: Easily evaluate various assumptions and analyze their impacts on outcomes.
- Efficiency Booster: Remove the hassle of constructing intricate valuation models from the ground up.
How It Works
- Step 1: Download the Excel file.
- Step 2: Review Donegal Group Inc.'s (DGICA) pre-filled financial data and forecasts.
- Step 3: Modify key inputs such as revenue growth, WACC, and tax rates (highlighted cells).
- Step 4: Observe the DCF model update in real-time as you adjust your assumptions.
- Step 5: Analyze the outputs and utilize the results for your investment decisions.
Why Choose This Calculator for Donegal Group Inc. (DGICA)?
- User-Friendly Interface: Perfect for both novices and seasoned professionals.
- Customizable Inputs: Adjust parameters to tailor your financial analysis.
- Real-Time Feedback: Instantly observe changes in Donegal's valuation as you modify inputs.
- Preloaded Data: Comes equipped with Donegal Group's actual financial metrics for swift evaluations.
- Relied Upon by Experts: A preferred tool among investors and analysts for making sound decisions.
Who Should Use Donegal Group Inc. (DGICA)?
- Insurance Professionals: Develop comprehensive risk assessment models for underwriting decisions.
- Financial Analysts: Conduct in-depth analyses of valuation metrics to inform investment strategies.
- Consultants and Advisors: Deliver precise valuation assessments for clients considering investments in Donegal Group Inc. (DGICA).
- Students and Educators: Utilize real market data to learn and teach insurance finance principles.
- Industry Enthusiasts: Gain insights into how insurance companies like Donegal Group Inc. (DGICA) are evaluated within the financial sector.
What the Template Contains
- Historical Data: Includes Donegal Group Inc.'s (DGICA) past financials and baseline forecasts.
- DCF and Levered DCF Models: Detailed templates to calculate Donegal Group Inc.'s (DGICA) intrinsic value.
- WACC Sheet: Pre-built calculations for Weighted Average Cost of Capital.
- Editable Inputs: Modify key drivers like growth rates, EBITDA %, and CAPEX assumptions.
- Quarterly and Annual Statements: A complete breakdown of Donegal Group Inc.'s (DGICA) financials.
- Interactive Dashboard: Visualize valuation results and projections dynamically.
Disclaimer
All information, articles, and product details provided on this website are for general informational and educational purposes only. We do not claim any ownership over, nor do we intend to infringe upon, any trademarks, copyrights, logos, brand names, or other intellectual property mentioned or depicted on this site. Such intellectual property remains the property of its respective owners, and any references here are made solely for identification or informational purposes, without implying any affiliation, endorsement, or partnership.
We make no representations or warranties, express or implied, regarding the accuracy, completeness, or suitability of any content or products presented. Nothing on this website should be construed as legal, tax, investment, financial, medical, or other professional advice. In addition, no part of this site—including articles or product references—constitutes a solicitation, recommendation, endorsement, advertisement, or offer to buy or sell any securities, franchises, or other financial instruments, particularly in jurisdictions where such activity would be unlawful.
All content is of a general nature and may not address the specific circumstances of any individual or entity. It is not a substitute for professional advice or services. Any actions you take based on the information provided here are strictly at your own risk. You accept full responsibility for any decisions or outcomes arising from your use of this website and agree to release us from any liability in connection with your use of, or reliance upon, the content or products found herein.