|
Valoración DCF de Quest Diagnostics Incorporated (DGX) |
Completamente Editable: Adáptelo A Sus Necesidades En Excel O Sheets
Diseño Profesional: Plantillas Confiables Y Estándares De La Industria
Predeterminadas Para Un Uso Rápido Y Eficiente
Compatible con MAC / PC, completamente desbloqueado
No Se Necesita Experiencia; Fáciles De Seguir
Quest Diagnostics Incorporated (DGX) Bundle
¡Mejore su estrategia de inversión con la calculadora DCF (DGX)! Utilice datos financieros de diagnóstico de Quest auténtico, ajuste las predicciones y gastos de crecimiento, y observe instantáneamente cómo estas modificaciones afectan el valor intrínseco de (DGX).
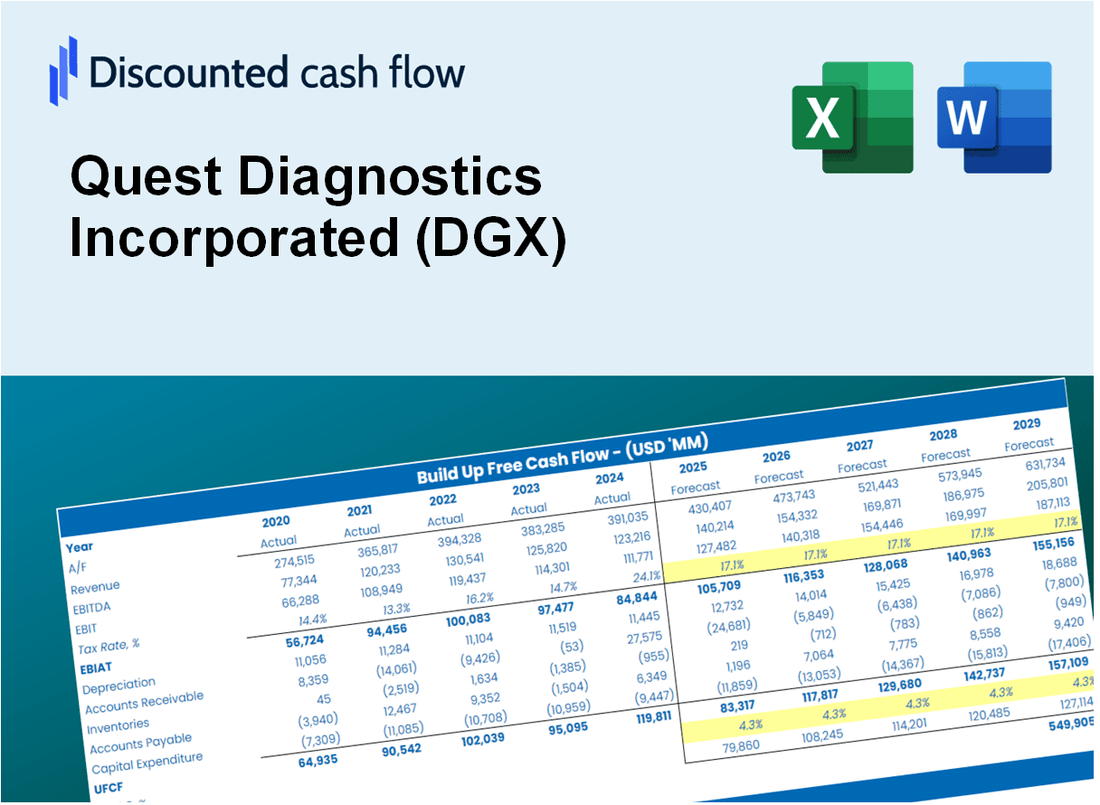
Discounted Cash Flow (DCF) - (USD MM)
| Year | AY1 2020 |
AY2 2021 |
AY3 2022 |
AY4 2023 |
AY5 2024 |
FY1 2025 |
FY2 2026 |
FY3 2027 |
FY4 2028 |
FY5 2029 |
|---|---|---|---|---|---|---|---|---|---|---|
| Revenue | 9,437.0 | 10,788.0 | 9,883.0 | 9,252.0 | 9,872.0 | 10,026.1 | 10,182.6 | 10,341.5 | 10,502.9 | 10,666.9 |
| Revenue Growth, % | 0 | 14.32 | -8.39 | -6.38 | 6.7 | 1.56 | 1.56 | 1.56 | 1.56 | 1.56 |
| EBITDA | 2,411.0 | 3,159.0 | 1,820.0 | 1,732.0 | 1,894.0 | 2,228.8 | 2,263.6 | 2,299.0 | 2,334.9 | 2,371.3 |
| EBITDA, % | 25.55 | 29.28 | 18.42 | 18.72 | 19.19 | 22.23 | 22.23 | 22.23 | 22.23 | 22.23 |
| Depreciation | 361.0 | 408.0 | 437.0 | 439.0 | 493.0 | 436.5 | 443.3 | 450.2 | 457.3 | 464.4 |
| Depreciation, % | 3.83 | 3.78 | 4.42 | 4.74 | 4.99 | 4.35 | 4.35 | 4.35 | 4.35 | 4.35 |
| EBIT | 2,050.0 | 2,751.0 | 1,383.0 | 1,293.0 | 1,401.0 | 1,792.4 | 1,820.3 | 1,848.7 | 1,877.6 | 1,906.9 |
| EBIT, % | 21.72 | 25.5 | 13.99 | 13.98 | 14.19 | 17.88 | 17.88 | 17.88 | 17.88 | 17.88 |
| Total Cash | 1,158.0 | 872.0 | 315.0 | 686.0 | 549.0 | 732.2 | 743.7 | 755.3 | 767.1 | 779.0 |
| Total Cash, percent | .0 | .0 | .0 | .0 | .0 | .0 | .0 | .0 | .0 | .0 |
| Account Receivables | 1,520.0 | 1,438.0 | 1,195.0 | 1,210.0 | 1,304.0 | 1,359.8 | 1,381.1 | 1,402.6 | 1,424.5 | 1,446.8 |
| Account Receivables, % | 16.11 | 13.33 | 12.09 | 13.08 | 13.21 | 13.56 | 13.56 | 13.56 | 13.56 | 13.56 |
| Inventories | 223.0 | 208.0 | 192.0 | 190.0 | 188.0 | 204.4 | 207.6 | 210.8 | 214.1 | 217.4 |
| Inventories, % | 2.36 | 1.93 | 1.94 | 2.05 | 1.9 | 2.04 | 2.04 | 2.04 | 2.04 | 2.04 |
| Accounts Payable | 446.0 | 357.0 | 324.0 | 378.0 | 287.0 | 367.1 | 372.8 | 378.6 | 384.5 | 390.5 |
| Accounts Payable, % | 4.73 | 3.31 | 3.28 | 4.09 | 2.91 | 3.66 | 3.66 | 3.66 | 3.66 | 3.66 |
| Capital Expenditure | -418.0 | -403.0 | -404.0 | -408.0 | -425.0 | -420.5 | -427.0 | -433.7 | -440.4 | -447.3 |
| Capital Expenditure, % | -4.43 | -3.74 | -4.09 | -4.41 | -4.31 | -4.19 | -4.19 | -4.19 | -4.19 | -4.19 |
| Tax Rate, % | 27.05 | 27.05 | 27.05 | 27.05 | 27.05 | 27.05 | 27.05 | 27.05 | 27.05 | 27.05 |
| EBITAT | 1,497.5 | 2,050.1 | 1,022.9 | 955.2 | 1,022.0 | 1,320.5 | 1,341.1 | 1,362.0 | 1,383.3 | 1,404.9 |
| Depreciation | ||||||||||
| Changes in Account Receivables | ||||||||||
| Changes in Inventories | ||||||||||
| Changes in Accounts Payable | ||||||||||
| Capital Expenditure | ||||||||||
| UFCF | 143.5 | 2,063.1 | 1,281.9 | 1,027.2 | 907.0 | 1,344.4 | 1,338.7 | 1,359.6 | 1,380.8 | 1,402.3 |
| WACC, % | 5.35 | 5.36 | 5.35 | 5.35 | 5.35 | 5.35 | 5.35 | 5.35 | 5.35 | 5.35 |
| PV UFCF | ||||||||||
| SUM PV UFCF | 5,846.4 | |||||||||
| Long Term Growth Rate, % | 2.00 | |||||||||
| Free cash flow (T + 1) | 1,430 | |||||||||
| Terminal Value | 42,678 | |||||||||
| Present Terminal Value | 32,885 | |||||||||
| Enterprise Value | 38,732 | |||||||||
| Net Debt | 6,538 | |||||||||
| Equity Value | 32,194 | |||||||||
| Diluted Shares Outstanding, MM | 113 | |||||||||
| Equity Value Per Share | 284.90 |
What You Will Get
- Real DGX Financial Data: Pre-filled with Quest Diagnostics' historical and projected data for precise analysis.
- Fully Editable Template: Modify key inputs like revenue growth, WACC, and EBITDA % with ease.
- Automatic Calculations: See Quest Diagnostics' intrinsic value update instantly based on your changes.
- Professional Valuation Tool: Designed for investors, analysts, and consultants seeking accurate DCF results.
- User-Friendly Design: Simple structure and clear instructions for all experience levels.
Key Features
- Comprehensive DGX Data: Pre-filled with Quest Diagnostics' historical performance and future projections.
- Fully Customizable Inputs: Modify revenue growth, profit margins, discount rates, tax implications, and capital expenditures.
- Dynamic Valuation Model: Instant updates to Net Present Value (NPV) and intrinsic value reflecting your adjustments.
- Scenario Testing: Develop various forecasting scenarios to evaluate different valuation possibilities.
- User-Friendly Design: Intuitive, organized, and crafted for both professionals and newcomers.
How It Works
- Download: Access the ready-to-use Excel file with Quest Diagnostics Incorporated’s (DGX) financial data.
- Customize: Adjust forecasts, including revenue growth, EBITDA %, and WACC.
- Update Automatically: The intrinsic value and NPV calculations update in real-time.
- Test Scenarios: Create multiple projections and compare outcomes instantly.
- Make Decisions: Use the valuation results to guide your investment strategy.
Why Choose Quest Diagnostics Incorporated (DGX)?
- Save Time: Access comprehensive diagnostics solutions without the hassle of building from the ground up.
- Enhance Accuracy: Utilize dependable testing methods and data to minimize errors in results.
- Fully Customizable: Adjust services to meet your specific healthcare needs and preferences.
- Easy to Understand: User-friendly reports and visuals simplify the interpretation of diagnostic results.
- Trusted by Professionals: Renowned for delivering reliable services that healthcare providers rely on for patient care.
Who Should Use This Product?
- Healthcare Investors: Develop comprehensive and accurate valuation models for analyzing Quest Diagnostics Incorporated (DGX).
- Corporate Finance Teams: Evaluate valuation scenarios to inform strategic decisions within the healthcare sector.
- Consultants and Advisors: Offer clients precise valuation insights for Quest Diagnostics Incorporated (DGX) stock.
- Students and Educators: Utilize real-world data to practice and teach financial modeling in the healthcare industry.
- Health Sector Enthusiasts: Gain insights into how companies like Quest Diagnostics Incorporated (DGX) are valued in the market.
What the Template Contains
- Pre-Filled Data: Includes Quest Diagnostics' historical financials and projections.
- Discounted Cash Flow Model: Editable DCF valuation model with automated calculations.
- Weighted Average Cost of Capital (WACC): A dedicated sheet for calculating WACC based on user-defined inputs.
- Key Financial Ratios: Evaluate Quest Diagnostics' profitability, efficiency, and leverage.
- Customizable Inputs: Easily adjust revenue growth, margins, and tax rates.
- Clear Dashboard: Visuals and tables summarizing essential valuation outcomes.
Disclaimer
All information, articles, and product details provided on this website are for general informational and educational purposes only. We do not claim any ownership over, nor do we intend to infringe upon, any trademarks, copyrights, logos, brand names, or other intellectual property mentioned or depicted on this site. Such intellectual property remains the property of its respective owners, and any references here are made solely for identification or informational purposes, without implying any affiliation, endorsement, or partnership.
We make no representations or warranties, express or implied, regarding the accuracy, completeness, or suitability of any content or products presented. Nothing on this website should be construed as legal, tax, investment, financial, medical, or other professional advice. In addition, no part of this site—including articles or product references—constitutes a solicitation, recommendation, endorsement, advertisement, or offer to buy or sell any securities, franchises, or other financial instruments, particularly in jurisdictions where such activity would be unlawful.
All content is of a general nature and may not address the specific circumstances of any individual or entity. It is not a substitute for professional advice or services. Any actions you take based on the information provided here are strictly at your own risk. You accept full responsibility for any decisions or outcomes arising from your use of this website and agree to release us from any liability in connection with your use of, or reliance upon, the content or products found herein.