
|
1stdibs.Com, Inc. (DIBS) DCF Valuation |
Completamente Editable: Adáptelo A Sus Necesidades En Excel O Sheets
Diseño Profesional: Plantillas Confiables Y Estándares De La Industria
Predeterminadas Para Un Uso Rápido Y Eficiente
Compatible con MAC / PC, completamente desbloqueado
No Se Necesita Experiencia; Fáciles De Seguir
1stdibs.Com, Inc. (DIBS) Bundle
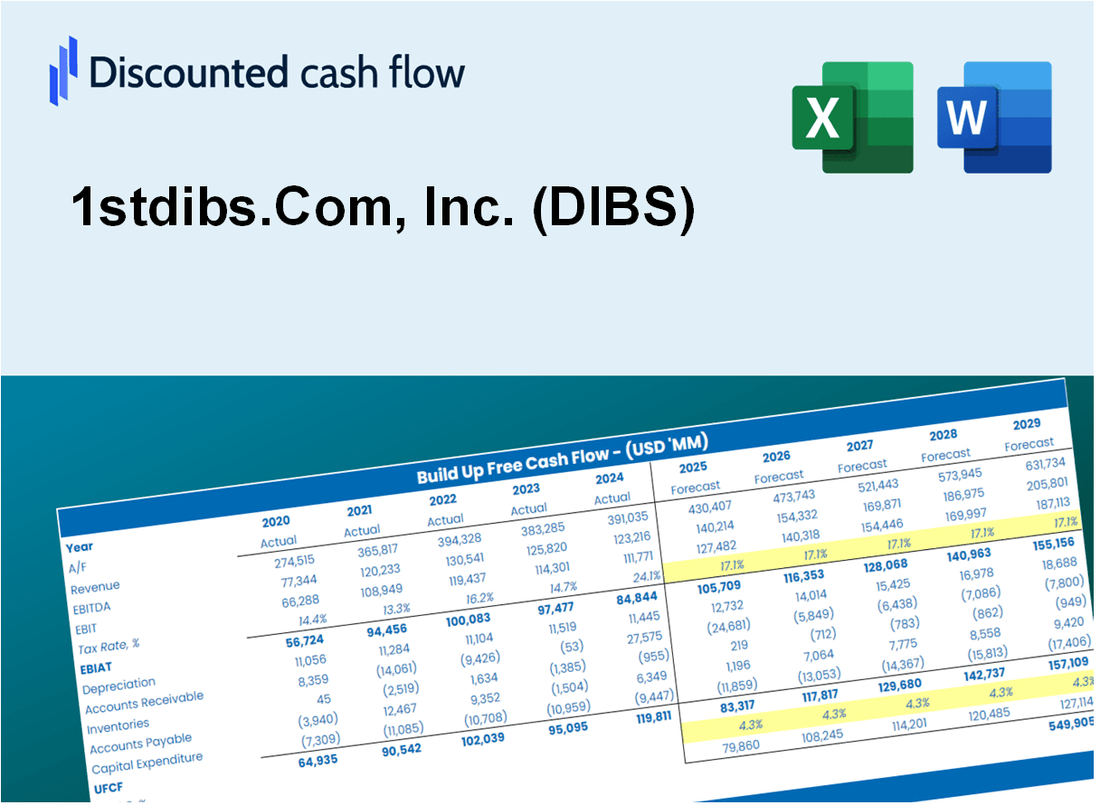
Explore 1stdibs.Com, Inc.'s (DIBS) financial outlook with our user-friendly DCF Calculator! Enter your predictions for growth, margins, and expenses to calculate 1stdibs.Com, Inc.'s (DIBS) intrinsic value and shape your investment approach.
Discounted Cash Flow (DCF) - (USD MM)
| Year | AY1 2021 |
AY2 2022 |
AY3 2023 |
AY4 2024 |
AY5 2025 |
FY1 2026 |
FY2 2027 |
FY3 2028 |
FY4 2029 |
FY5 2030 |
|---|---|---|---|---|---|---|---|---|---|---|
| Revenue | 102.7 | 96.8 | 84.7 | 88.3 | 89.6 | 90.5 | 91.0 | 91.3 | 91.5 | 91.6 |
| Revenue Growth, % | 0 | -5.73 | -12.56 | 4.22 | 1.54 | 0.93464 | 0.56564 | 0.34233 | 0.20718 | 0.12538 |
| EBITDA | -17.8 | -17.2 | -17.8 | -13.2 | -8.3 | -6.7 | -5.1 | -3.5 | -2.0 | -.4 |
| EBITDA, % | -17.34 | -17.8 | -21.03 | -14.93 | -9.23 | -7.41 | -5.62 | -3.86 | -2.13 | -0.43158 |
| Depreciation | 3.1 | 5.3 | 4.9 | 5.4 | 5.3 | 5.9 | 6.5 | 7.1 | 7.7 | 8.3 |
| Depreciation, % | 3.03 | 5.42 | 5.76 | 6.13 | 5.91 | 6.55 | 7.18 | 7.81 | 8.43 | 9.05 |
| EBIT | -20.9 | -22.5 | -22.7 | -18.6 | -13.6 | -12.6 | -11.6 | -10.5 | -9.5 | -8.4 |
| EBIT, % | -20.37 | -23.22 | -26.79 | -21.06 | -15.14 | -13.92 | -12.71 | -11.52 | -10.34 | -9.17 |
| Total Cash | 168.2 | 153.2 | 139.3 | 103.9 | 95.0 | 90.5 | 91.0 | 91.3 | 91.5 | 91.6 |
| Total Cash, percent | .0 | .0 | .0 | .0 | .0 | .0 | .0 | .0 | .0 | .0 |
| Account Receivables | 2.8 | 3.4 | 3.3 | 3.3 | .4 | 2.6 | 2.6 | 2.6 | 2.6 | 2.7 |
| Account Receivables, % | 2.77 | 3.56 | 3.91 | 3.77 | 0.47088 | 2.9 | 2.9 | 2.9 | 2.9 | 2.9 |
| Inventories | .0 | .0 | .0 | .0 | .0 | .0 | .0 | .0 | .0 | .0 |
| Inventories, % | 0 | 0 | 0 | 0 | 0 | 0 | 0 | 0 | 0 | 0 |
| Accounts Payable | 15.0 | 10.1 | 10.1 | 10.8 | 1.8 | 9.3 | 9.3 | 9.3 | 9.4 | 9.4 |
| Accounts Payable, % | 14.56 | 10.42 | 11.93 | 12.27 | 1.97 | 10.23 | 10.23 | 10.23 | 10.23 | 10.23 |
| Capital Expenditure | -2.2 | -2.0 | -1.8 | -.6 | -.8 | -1.4 | -1.4 | -1.4 | -1.4 | -1.4 |
| Capital Expenditure, % | -2.18 | -2.03 | -2.12 | -0.70023 | -0.85137 | -1.58 | -1.58 | -1.58 | -1.58 | -1.58 |
| Tax Rate, % | -0.72229 | -0.72229 | -0.72229 | -0.72229 | -0.72229 | -0.72229 | -0.72229 | -0.72229 | -0.72229 | -0.72229 |
| EBITAT | -20.9 | -22.5 | -22.7 | -18.6 | -13.7 | -12.6 | -11.6 | -10.5 | -9.5 | -8.4 |
| Depreciation | ||||||||||
| Changes in Account Receivables | ||||||||||
| Changes in Inventories | ||||||||||
| Changes in Accounts Payable | ||||||||||
| Capital Expenditure | ||||||||||
| UFCF | -8.0 | -24.7 | -19.5 | -13.1 | -15.3 | -2.8 | -6.4 | -4.8 | -3.2 | -1.5 |
| WACC, % | 8.33 | 8.33 | 8.33 | 8.33 | 8.33 | 8.33 | 8.33 | 8.33 | 8.33 | 8.33 |
| PV UFCF | ||||||||||
| SUM PV UFCF | -15.2 | |||||||||
| Long Term Growth Rate, % | 2.00 | |||||||||
| Free cash flow (T + 1) | -2 | |||||||||
| Terminal Value | -25 | |||||||||
| Present Terminal Value | -17 | |||||||||
| Enterprise Value | -32 | |||||||||
| Net Debt | -4 | |||||||||
| Equity Value | -28 | |||||||||
| Diluted Shares Outstanding, MM | 36 | |||||||||
| Equity Value Per Share | -0.76 |
What You Will Get
- Editable Excel Template: A fully customizable Excel-based DCF Calculator featuring pre-filled real 1stdibs.Com, Inc. (DIBS) financials.
- Real-World Data: Access to historical data and forward-looking estimates (highlighted in the yellow cells).
- Forecast Flexibility: Adjust forecast assumptions such as revenue growth, EBITDA %, and WACC.
- Automatic Calculations: Instantly observe the effects of your inputs on 1stdibs.Com, Inc. (DIBS) valuation.
- Professional Tool: Designed for investors, CFOs, consultants, and financial analysts.
- User-Friendly Design: Organized for clarity and ease of use, complete with step-by-step instructions.
Key Features
- Comprehensive Listings: Access to 1stdibs’ extensive collection of luxury items and antiques.
- Customizable Search Filters: Tailor your search by category, price range, and location.
- Real-Time Inventory Updates: Stay informed with live updates on available products.
- Engaging Visual Displays: High-quality images and detailed descriptions enhance the shopping experience.
- Designed for Connoisseurs: A premium platform catering to collectors, designers, and discerning buyers.
How It Works
- Step 1: Download the Excel file.
- Step 2: Review 1stdibs.Com, Inc.'s (DIBS) pre-filled financial data and forecasts.
- Step 3: Modify key inputs such as revenue growth, WACC, and tax rates (highlighted cells).
- Step 4: Observe the DCF model update in real-time as you adjust the assumptions.
- Step 5: Analyze the results and leverage the outputs for your investment strategies.
Why Choose This Calculator for 1stdibs.Com, Inc. (DIBS)?
- Accurate Data: Real 1stdibs financials provide dependable valuation results.
- Customizable: Modify essential parameters such as growth rates, WACC, and tax rates to align with your forecasts.
- Time-Saving: Pre-configured calculations save you the effort of starting from the ground up.
- Professional-Grade Tool: Tailored for investors, analysts, and consultants in the luxury market.
- User-Friendly: Easy-to-navigate layout and clear instructions make it accessible for all users.
Who Should Use 1stdibs.Com, Inc. (DIBS)?
- Interior Designers: Discover unique luxury items to elevate your design projects.
- Collectors: Explore rare and vintage pieces to enhance your collection.
- Homeowners: Find exclusive decor and furniture to personalize your living space.
- Real Estate Professionals: Utilize high-end furnishings to stage properties effectively.
- Art Enthusiasts: Access a curated selection of art and design objects from around the world.
What the Template Contains
- Pre-Filled DCF Model: 1stdibs.Com, Inc.’s (DIBS) financial data preloaded for immediate use.
- WACC Calculator: Detailed calculations for Weighted Average Cost of Capital.
- Financial Ratios: Evaluate 1stdibs.Com, Inc.’s (DIBS) profitability, leverage, and efficiency.
- Editable Inputs: Change assumptions such as growth, margins, and CAPEX to fit your scenarios.
- Financial Statements: Annual and quarterly reports to support detailed analysis.
- Interactive Dashboard: Easily visualize key valuation metrics and results.
Disclaimer
All information, articles, and product details provided on this website are for general informational and educational purposes only. We do not claim any ownership over, nor do we intend to infringe upon, any trademarks, copyrights, logos, brand names, or other intellectual property mentioned or depicted on this site. Such intellectual property remains the property of its respective owners, and any references here are made solely for identification or informational purposes, without implying any affiliation, endorsement, or partnership.
We make no representations or warranties, express or implied, regarding the accuracy, completeness, or suitability of any content or products presented. Nothing on this website should be construed as legal, tax, investment, financial, medical, or other professional advice. In addition, no part of this site—including articles or product references—constitutes a solicitation, recommendation, endorsement, advertisement, or offer to buy or sell any securities, franchises, or other financial instruments, particularly in jurisdictions where such activity would be unlawful.
All content is of a general nature and may not address the specific circumstances of any individual or entity. It is not a substitute for professional advice or services. Any actions you take based on the information provided here are strictly at your own risk. You accept full responsibility for any decisions or outcomes arising from your use of this website and agree to release us from any liability in connection with your use of, or reliance upon, the content or products found herein.