
|
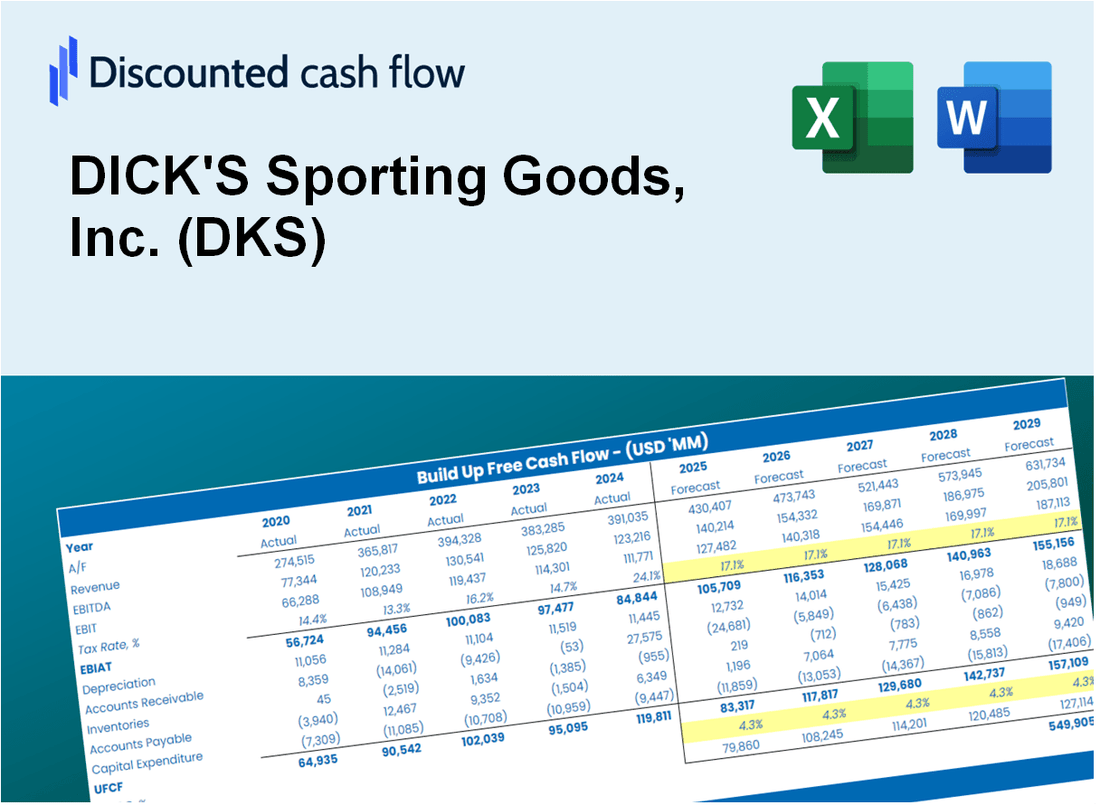
Valoración DCF de DICK'S Sporting Goods, Inc. (DKS) |
Completamente Editable: Adáptelo A Sus Necesidades En Excel O Sheets
Diseño Profesional: Plantillas Confiables Y Estándares De La Industria
Predeterminadas Para Un Uso Rápido Y Eficiente
Compatible con MAC / PC, completamente desbloqueado
No Se Necesita Experiencia; Fáciles De Seguir
DICK'S Sporting Goods, Inc. (DKS) Bundle
Diseñada para la precisión, nuestra calculadora DCF (DKS) le permite evaluar la valoración de Dick's Sporting Goods, Inc. con datos financieros del mundo real y una flexibilidad completa para modificar todos los parámetros esenciales para mejorar las proyecciones.
Discounted Cash Flow (DCF) - (USD MM)
| Year | AY1 2020 |
AY2 2021 |
AY3 2022 |
AY4 2023 |
AY5 2024 |
FY1 2025 |
FY2 2026 |
FY3 2027 |
FY4 2028 |
FY5 2029 |
|---|---|---|---|---|---|---|---|---|---|---|
| Revenue | 9,584.0 | 12,293.4 | 12,368.2 | 12,984.4 | 13,442.8 | 14,699.5 | 16,073.5 | 17,576.0 | 19,219.0 | 21,015.6 |
| Revenue Growth, % | 0 | 28.27 | 0.6087 | 4.98 | 3.53 | 9.35 | 9.35 | 9.35 | 9.35 | 9.35 |
| EBITDA | 1,086.6 | 2,371.7 | 1,844.4 | 1,770.1 | 1,972.4 | 2,171.0 | 2,374.0 | 2,595.9 | 2,838.6 | 3,103.9 |
| EBITDA, % | 11.34 | 19.29 | 14.91 | 13.63 | 14.67 | 14.77 | 14.77 | 14.77 | 14.77 | 14.77 |
| Depreciation | 326.0 | 319.4 | 365.5 | 393.9 | 400.4 | 440.0 | 481.2 | 526.1 | 575.3 | 629.1 |
| Depreciation, % | 3.4 | 2.6 | 2.95 | 3.03 | 2.98 | 2.99 | 2.99 | 2.99 | 2.99 | 2.99 |
| EBIT | 760.5 | 2,052.3 | 1,479.0 | 1,376.2 | 1,572.0 | 1,731.0 | 1,892.8 | 2,069.8 | 2,263.2 | 2,474.8 |
| EBIT, % | 7.94 | 16.69 | 11.96 | 10.6 | 11.69 | 11.78 | 11.78 | 11.78 | 11.78 | 11.78 |
| Total Cash | 1,658.1 | 2,643.2 | 1,924.4 | 1,801.2 | 1,689.9 | 2,375.6 | 2,597.6 | 2,840.4 | 3,105.9 | 3,396.3 |
| Total Cash, percent | .0 | .0 | .0 | .0 | .0 | .0 | .0 | .0 | .0 | .0 |
| Account Receivables | 59.5 | 70.2 | 79.5 | 119.0 | 219.2 | 128.8 | 140.9 | 154.0 | 168.4 | 184.2 |
| Account Receivables, % | 0.62129 | 0.57137 | 0.64256 | 0.91637 | 1.63 | 0.8764 | 0.8764 | 0.8764 | 0.8764 | 0.8764 |
| Inventories | 1,953.6 | 2,297.6 | 2,830.9 | 2,848.8 | 3,349.8 | 3,199.2 | 3,498.3 | 3,825.3 | 4,182.9 | 4,573.9 |
| Inventories, % | 20.38 | 18.69 | 22.89 | 21.94 | 24.92 | 21.76 | 21.76 | 21.76 | 21.76 | 21.76 |
| Accounts Payable | 1,258.1 | 1,281.3 | 1,206.1 | 1,288.7 | 1,497.7 | 1,598.4 | 1,747.8 | 1,911.1 | 2,089.8 | 2,285.1 |
| Accounts Payable, % | 13.13 | 10.42 | 9.75 | 9.93 | 11.14 | 10.87 | 10.87 | 10.87 | 10.87 | 10.87 |
| Capital Expenditure | -224.0 | -308.3 | -364.1 | -587.4 | -802.6 | -537.5 | -587.7 | -642.7 | -702.8 | -768.5 |
| Capital Expenditure, % | -2.34 | -2.51 | -2.94 | -4.52 | -5.97 | -3.66 | -3.66 | -3.66 | -3.66 | -3.66 |
| Tax Rate, % | 23.29 | 23.29 | 23.29 | 23.29 | 23.29 | 23.29 | 23.29 | 23.29 | 23.29 | 23.29 |
| EBITAT | 566.6 | 1,563.9 | 1,114.9 | 1,092.6 | 1,206.0 | 1,323.2 | 1,446.9 | 1,582.1 | 1,730.0 | 1,891.7 |
| Depreciation | ||||||||||
| Changes in Account Receivables | ||||||||||
| Changes in Inventories | ||||||||||
| Changes in Accounts Payable | ||||||||||
| Capital Expenditure | ||||||||||
| UFCF | -86.4 | 1,243.6 | 498.5 | 924.4 | 411.6 | 1,567.3 | 1,178.6 | 1,288.8 | 1,409.2 | 1,541.0 |
| WACC, % | 8.05 | 8.06 | 8.05 | 8.08 | 8.06 | 8.06 | 8.06 | 8.06 | 8.06 | 8.06 |
| PV UFCF | ||||||||||
| SUM PV UFCF | 5,560.4 | |||||||||
| Long Term Growth Rate, % | 0.50 | |||||||||
| Free cash flow (T + 1) | 1,549 | |||||||||
| Terminal Value | 20,484 | |||||||||
| Present Terminal Value | 13,902 | |||||||||
| Enterprise Value | 19,462 | |||||||||
| Net Debt | 2,798 | |||||||||
| Equity Value | 16,665 | |||||||||
| Diluted Shares Outstanding, MM | 83 | |||||||||
| Equity Value Per Share | 200.95 |
What You Will Get
- Pre-Filled Financial Model: DICK'S Sporting Goods' actual data facilitates accurate DCF valuation.
- Full Forecast Control: Modify revenue growth, profit margins, WACC, and other essential drivers.
- Instant Calculations: Automatic updates provide real-time results as you make adjustments.
- Investor-Ready Template: A polished Excel file crafted for professional-standard valuation.
- Customizable and Reusable: Designed for adaptability, allowing repeated usage for comprehensive forecasts.
Key Features
- Comprehensive DCF Calculator: Features detailed unlevered and levered DCF valuation models tailored for DICK'S Sporting Goods, Inc. (DKS).
- WACC Calculator: Ready-to-use Weighted Average Cost of Capital sheet with adjustable parameters.
- Customizable Forecast Assumptions: Adjust growth rates, capital expenditures, and discount rates to fit DICK'S Sporting Goods' strategy.
- Integrated Financial Ratios: Evaluate profitability, leverage, and efficiency ratios specifically for DICK'S Sporting Goods, Inc. (DKS).
- Interactive Dashboard and Charts: Visual representations highlight key valuation metrics for straightforward analysis.
How It Works
- Step 1: Download the Excel file.
- Step 2: Review DICK'S Sporting Goods' pre-filled financial data and forecasts.
- Step 3: Adjust key inputs such as sales growth, WACC, and tax rates (highlighted cells).
- Step 4: Observe the DCF model update in real-time as you modify your assumptions.
- Step 5: Evaluate the outputs and leverage the results for your investment strategies.
Why Choose This Calculator?
- Accurate Data: Real DICK'S Sporting Goods financials ensure reliable valuation results.
- Customizable: Adjust key parameters like growth rates, WACC, and tax rates to match your projections.
- Time-Saving: Pre-built calculations eliminate the need to start from scratch.
- Professional-Grade Tool: Designed for investors, analysts, and consultants.
- User-Friendly: Intuitive layout and step-by-step instructions make it easy for all users.
Who Should Use This Product?
- Investors: Evaluate DICK'S Sporting Goods' (DKS) performance before making investment decisions.
- CFOs and Financial Analysts: Optimize valuation methodologies and assess financial forecasts.
- Retail Entrepreneurs: Understand the valuation strategies of successful retail companies like DICK'S Sporting Goods.
- Consultants: Create comprehensive valuation analyses for retail clients.
- Students and Educators: Utilize current market data to explore and teach valuation principles.
What the Template Contains
- Comprehensive DCF Model: Editable template featuring detailed valuation calculations tailored for DICK'S Sporting Goods, Inc. (DKS).
- Real-World Data: DICK'S Sporting Goods’ historical and projected financials preloaded for thorough analysis.
- Customizable Parameters: Modify WACC, growth rates, and tax assumptions to explore various scenarios.
- Financial Statements: Complete annual and quarterly breakdowns for enhanced insights into DICK'S Sporting Goods, Inc. (DKS).
- Key Ratios: Integrated analysis for profitability, efficiency, and leverage specific to DICK'S Sporting Goods, Inc. (DKS).
- Dashboard with Visual Outputs: Engaging charts and tables for clear, actionable results regarding DICK'S Sporting Goods, Inc. (DKS).
Disclaimer
All information, articles, and product details provided on this website are for general informational and educational purposes only. We do not claim any ownership over, nor do we intend to infringe upon, any trademarks, copyrights, logos, brand names, or other intellectual property mentioned or depicted on this site. Such intellectual property remains the property of its respective owners, and any references here are made solely for identification or informational purposes, without implying any affiliation, endorsement, or partnership.
We make no representations or warranties, express or implied, regarding the accuracy, completeness, or suitability of any content or products presented. Nothing on this website should be construed as legal, tax, investment, financial, medical, or other professional advice. In addition, no part of this site—including articles or product references—constitutes a solicitation, recommendation, endorsement, advertisement, or offer to buy or sell any securities, franchises, or other financial instruments, particularly in jurisdictions where such activity would be unlawful.
All content is of a general nature and may not address the specific circumstances of any individual or entity. It is not a substitute for professional advice or services. Any actions you take based on the information provided here are strictly at your own risk. You accept full responsibility for any decisions or outcomes arising from your use of this website and agree to release us from any liability in connection with your use of, or reliance upon, the content or products found herein.