
|
DLF LIMITED (DLF.NS) DCF Valoración |
Completamente Editable: Adáptelo A Sus Necesidades En Excel O Sheets
Diseño Profesional: Plantillas Confiables Y Estándares De La Industria
Predeterminadas Para Un Uso Rápido Y Eficiente
Compatible con MAC / PC, completamente desbloqueado
No Se Necesita Experiencia; Fáciles De Seguir
DLF Limited (DLF.NS) Bundle
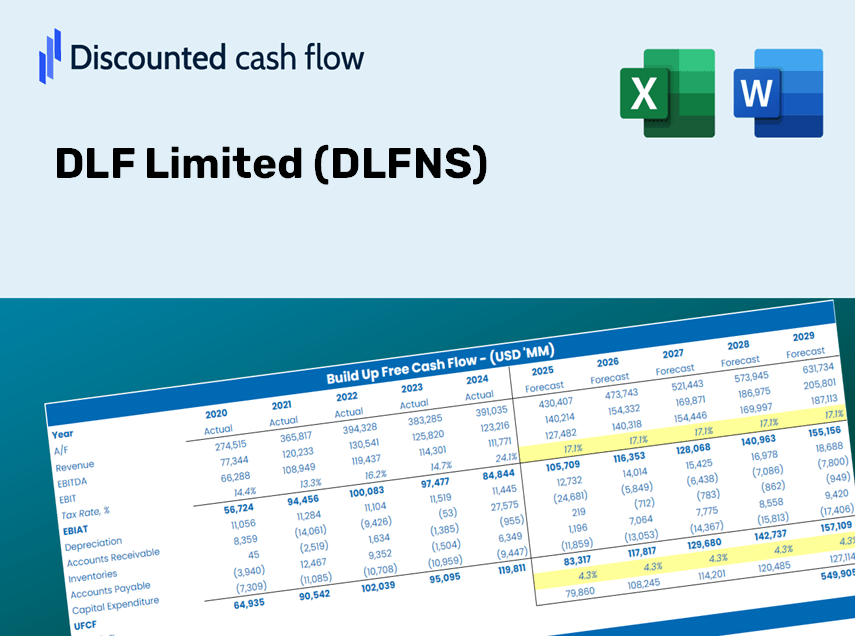
¡Descubra el verdadero valor de DLF Limited (DLFNS) con nuestra calculadora DCF avanzada! Ajuste los supuestos clave, explore varios escenarios y evalúe cómo los cambios afectan la valoración de DLF Limited (DLFNS), todo dentro de una plantilla de Excel conveniente.
Benefits of Choosing DLF Limited (DLFNS)
- Customizable Excel Template: An adaptable Excel-based DCF Calculator featuring pre-populated financial data for DLF Limited.
- Comprehensive Data: Historical information along with future projections (highlighted in the yellow cells).
- Flexible Forecasting: Adjust forecast parameters such as revenue growth, EBITDA margin, and WACC.
- Instant Calculations: Observe how your inputs affect the valuation of DLF Limited in real-time.
- Professional Resource: Designed for investors, CFOs, consultants, and financial analysts.
- User-Friendly Interface: Organized for ease of use, complete with detailed instructions to guide you.
Key Features
- Pre-Loaded Data: DLF Limited’s historical financial statements and pre-filled forecasts.
- Fully Adjustable Inputs: Modify WACC, tax rates, revenue growth, and EBITDA margins.
- Instant Results: Watch DLF Limited’s intrinsic value recalculate in real time.
- Clear Visual Outputs: Dashboard charts showcase valuation results and key metrics.
- Built for Accuracy: A professional tool designed for analysts, investors, and finance experts.
How It Works
- Step 1: Download the Excel file.
- Step 2: Examine DLF Limited's (DLFNS) pre-filled financial data and forecasts.
- Step 3: Adjust key inputs such as revenue growth, WACC, and tax rates (highlighted cells).
- Step 4: Observe the DCF model update in real-time as you modify the assumptions.
- Step 5: Evaluate the outputs and leverage the results for your investment decisions.
Why Choose the DLF Limited (DLFNS) Calculator?
- Precision: Utilizes authentic DLF financial data for reliable results.
- Versatility: Built for users to experiment with and adjust inputs as needed.
- Efficiency: Eliminate the complexities of creating a DCF model from the ground up.
- Expert-Level: Crafted with the accuracy and functionality expected by financial leaders.
- Intuitive Design: Simple to navigate, even for those new to financial modeling.
Who Should Use This Product?
- Individual Investors: Gain insights to make informed decisions regarding DLF Limited (DLFNS) stock transactions.
- Financial Analysts: Enhance valuation efforts with comprehensive financial models tailored for DLF Limited (DLFNS).
- Consultants: Provide clients with accurate and timely valuation analyses for DLF Limited (DLFNS).
- Business Owners: Learn about the valuation of major firms like DLF Limited (DLFNS) to inform your strategic planning.
- Finance Students: Acquire practical knowledge in valuation techniques through analysis of DLF Limited (DLFNS) and its historical data.
Contents of the Template
- Historical Data: Features past financials and foundational forecasts for DLF Limited (DLFNS).
- DCF and Levered DCF Models: Comprehensive templates for determining the intrinsic value of DLF Limited (DLFNS).
- WACC Sheet: Pre-calculated metrics for the Weighted Average Cost of Capital.
- Editable Inputs: Adjust essential parameters such as growth rates, EBITDA percentages, and CAPEX forecasts.
- Quarterly and Annual Statements: An extensive overview of DLF Limited's (DLFNS) financial statements.
- Interactive Dashboard: Dynamically visualize valuation outcomes and forecasts.
Disclaimer
All information, articles, and product details provided on this website are for general informational and educational purposes only. We do not claim any ownership over, nor do we intend to infringe upon, any trademarks, copyrights, logos, brand names, or other intellectual property mentioned or depicted on this site. Such intellectual property remains the property of its respective owners, and any references here are made solely for identification or informational purposes, without implying any affiliation, endorsement, or partnership.
We make no representations or warranties, express or implied, regarding the accuracy, completeness, or suitability of any content or products presented. Nothing on this website should be construed as legal, tax, investment, financial, medical, or other professional advice. In addition, no part of this site—including articles or product references—constitutes a solicitation, recommendation, endorsement, advertisement, or offer to buy or sell any securities, franchises, or other financial instruments, particularly in jurisdictions where such activity would be unlawful.
All content is of a general nature and may not address the specific circumstances of any individual or entity. It is not a substitute for professional advice or services. Any actions you take based on the information provided here are strictly at your own risk. You accept full responsibility for any decisions or outcomes arising from your use of this website and agree to release us from any liability in connection with your use of, or reliance upon, the content or products found herein.