
|
Dassault Systèmes SE (DSY.PA) Valoración de DCF |
Completamente Editable: Adáptelo A Sus Necesidades En Excel O Sheets
Diseño Profesional: Plantillas Confiables Y Estándares De La Industria
Predeterminadas Para Un Uso Rápido Y Eficiente
Compatible con MAC / PC, completamente desbloqueado
No Se Necesita Experiencia; Fáciles De Seguir
Dassault Systèmes SE (DSY.PA) Bundle
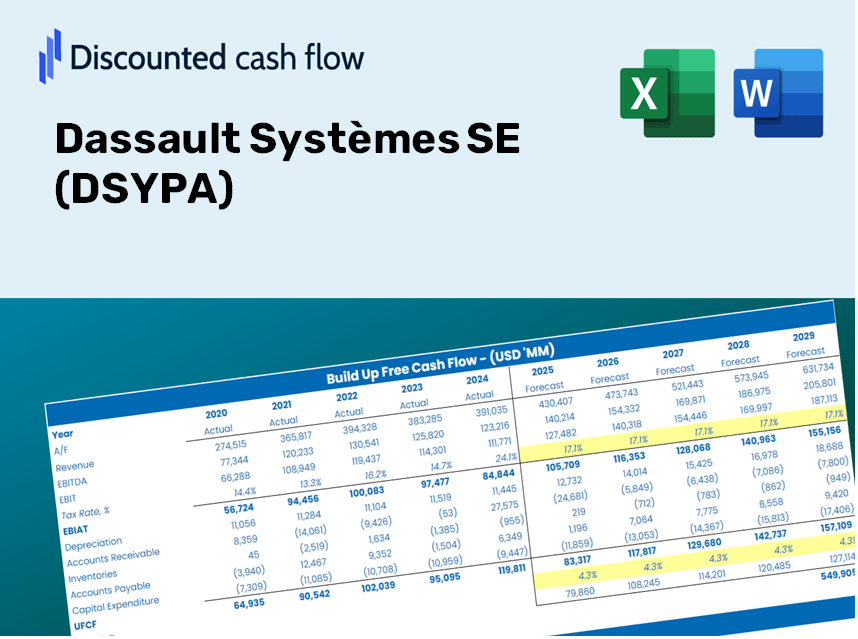
¡Obtenga dominio sobre su análisis de valoración de Dassault Systèmes SE (DSYPA) utilizando nuestra sofisticada calculadora DCF! Esta plantilla de Excel viene precargada con datos auténticos (DSYPA), lo que le permite ajustar los pronósticos y supuestos para un cálculo preciso del valor intrínseco de Dassault Systèmes SE.
Discounted Cash Flow (DCF) - (USD MM)
| Year | AY1 2020 |
AY2 2021 |
AY3 2022 |
AY4 2023 |
AY5 2024 |
FY1 2025 |
FY2 2026 |
FY3 2027 |
FY4 2028 |
FY5 2029 |
|---|---|---|---|---|---|---|---|---|---|---|
| Revenue | 4,452.2 | 4,860.1 | 5,665.2 | 5,951.4 | 6,213.6 | 6,760.2 | 7,354.8 | 8,001.7 | 8,705.6 | 9,471.4 |
| Revenue Growth, % | 0 | 9.16 | 16.57 | 5.05 | 4.41 | 8.8 | 8.8 | 8.8 | 8.8 | 8.8 |
| EBITDA | 1,288.0 | 1,593.0 | 1,942.4 | 1,811.4 | 1,920.7 | 2,127.3 | 2,314.4 | 2,518.0 | 2,739.5 | 2,980.5 |
| EBITDA, % | 28.93 | 32.78 | 34.29 | 30.44 | 30.91 | 31.47 | 31.47 | 31.47 | 31.47 | 31.47 |
| Depreciation | 604.5 | 560.5 | 610.8 | 569.5 | 561.0 | 736.7 | 801.5 | 872.0 | 948.7 | 1,032.2 |
| Depreciation, % | 13.58 | 11.53 | 10.78 | 9.57 | 9.03 | 10.9 | 10.9 | 10.9 | 10.9 | 10.9 |
| EBIT | 683.5 | 1,032.5 | 1,331.6 | 1,241.9 | 1,359.7 | 1,390.6 | 1,512.9 | 1,646.0 | 1,790.8 | 1,948.3 |
| EBIT, % | 15.35 | 21.24 | 23.5 | 20.87 | 21.88 | 20.57 | 20.57 | 20.57 | 20.57 | 20.57 |
| Total Cash | 2,148.9 | 2,979.5 | 2,769.0 | 3,568.3 | 3,952.6 | 3,813.0 | 4,148.4 | 4,513.3 | 4,910.3 | 5,342.2 |
| Total Cash, percent | .0 | .0 | .0 | .0 | .0 | .0 | .0 | .0 | .0 | .0 |
| Account Receivables | .0 | .0 | 1,834.6 | 1,734.7 | 2,151.0 | 1,300.0 | 1,414.3 | 1,538.7 | 1,674.1 | 1,821.3 |
| Account Receivables, % | 0 | 0 | 32.38 | 29.15 | 34.62 | 19.23 | 19.23 | 19.23 | 19.23 | 19.23 |
| Inventories | 136.1 | 179.4 | 207.9 | .0 | .0 | 140.9 | 153.2 | 166.7 | 181.4 | 197.3 |
| Inventories, % | 3.06 | 3.69 | 3.67 | 0 | 0 | 2.08 | 2.08 | 2.08 | 2.08 | 2.08 |
| Accounts Payable | 171.7 | 192.4 | 216.3 | 230.5 | 259.9 | 266.2 | 289.6 | 315.1 | 342.8 | 373.0 |
| Accounts Payable, % | 3.86 | 3.96 | 3.82 | 3.87 | 4.18 | 3.94 | 3.94 | 3.94 | 3.94 | 3.94 |
| Capital Expenditure | -127.0 | -103.7 | -132.3 | -145.3 | -193.4 | -174.1 | -189.4 | -206.1 | -224.2 | -243.9 |
| Capital Expenditure, % | -2.85 | -2.13 | -2.34 | -2.44 | -3.11 | -2.58 | -2.58 | -2.58 | -2.58 | -2.58 |
| Tax Rate, % | 18.8 | 18.8 | 18.8 | 18.8 | 18.8 | 18.8 | 18.8 | 18.8 | 18.8 | 18.8 |
| EBITAT | 519.3 | 795.4 | 950.1 | 1,003.2 | 1,104.1 | 1,074.5 | 1,169.0 | 1,271.8 | 1,383.7 | 1,505.4 |
| Depreciation | ||||||||||
| Changes in Account Receivables | ||||||||||
| Changes in Inventories | ||||||||||
| Changes in Accounts Payable | ||||||||||
| Capital Expenditure | ||||||||||
| UFCF | 1,032.4 | 1,229.6 | -410.6 | 1,749.4 | 1,084.8 | 2,353.6 | 1,677.8 | 1,825.4 | 1,986.0 | 2,160.6 |
| WACC, % | 6.26 | 6.26 | 6.24 | 6.27 | 6.28 | 6.26 | 6.26 | 6.26 | 6.26 | 6.26 |
| PV UFCF | ||||||||||
| SUM PV UFCF | 8,374.3 | |||||||||
| Long Term Growth Rate, % | 4.00 | |||||||||
| Free cash flow (T + 1) | 2,247 | |||||||||
| Terminal Value | 99,306 | |||||||||
| Present Terminal Value | 73,294 | |||||||||
| Enterprise Value | 81,668 | |||||||||
| Net Debt | -890 | |||||||||
| Equity Value | 82,559 | |||||||||
| Diluted Shares Outstanding, MM | 1,327 | |||||||||
| Equity Value Per Share | 62.24 |
What You'll Gain
- Customizable Excel Template: A fully editable Excel-based DCF Calculator featuring pre-populated financial data for Dassault Systèmes SE (DSYPA).
- Accurate Data Insights: Access to historical performance metrics and forecast estimates (highlighted in the yellow cells).
- Flexible Projections: Adjust key assumptions such as revenue growth, EBITDA percentage, and WACC to fit your analysis.
- Instant Calculations: Immediately observe how your assumptions affect the valuation of Dassault Systèmes SE (DSYPA).
- Professional Resource: Designed specifically for investors, CFOs, consultants, and financial analysts.
- User-Centric Interface: Organized for simplicity and efficiency, complete with clear step-by-step guidance.
Key Features
- Customizable Forecast Parameters: Adjust essential inputs such as revenue growth, EBITDA %, and capital investments.
- Instant DCF Valuation: Computes intrinsic value, NPV, and additional metrics on demand.
- Enterprise-Level Precision: Based on Dassault Systèmes' actual financial data for accurate valuation results.
- Effortless Scenario Analysis: Easily explore various assumptions and evaluate outcomes side by side.
- Efficiency Boost: Remove the hassle of constructing intricate valuation models from the ground up.
How It Functions
- Step 1: Download the preconfigured Excel template featuring Dassault Systèmes SE’s (DSYPA) data.
- Step 2: Review the pre-populated sheets to familiarize yourself with essential metrics.
- Step 3: Modify forecasts and assumptions in the editable yellow cells (WACC, growth, margins).
- Step 4: Instantly see updated results, including Dassault Systèmes SE’s (DSYPA) intrinsic value.
- Step 5: Use the outputs to make informed investment choices or prepare comprehensive reports.
Why Opt for This Calculator?
- Precise Data: Utilizes authentic Dassault Systèmes financial metrics for trustworthy valuation outcomes.
- Tailorable: Modify essential variables such as growth rates, WACC, and tax rates to align with your forecasts.
- Efficiency: Ready-made calculations save you the hassle of building from the ground up.
- Professional-Quality Tool: Crafted for investors, analysts, and consultants in the field.
- Easy to Use: User-friendly design and clear, step-by-step guidance ensure accessibility for all users.
Who Should Utilize This Product?
- Investors: Precisely assess the fair value of Dassault Systèmes SE (DSYPA) before making investment choices.
- CFOs: Utilize a top-tier DCF model for comprehensive financial reporting and analysis.
- Consultants: Efficiently customize the template for client valuation reports.
- Entrepreneurs: Acquire knowledge about financial modeling practices used by leading enterprises.
- Educators: Employ it as an educational resource to illustrate valuation techniques.
Contents of the Template
- Preloaded DSYPA Data: Historical and forecasted financial information, encompassing revenue, EBIT, and capital investments.
- DCF and WACC Models: Advanced sheets designed for calculating intrinsic value and Weighted Average Cost of Capital.
- Customizable Inputs: Yellow-highlighted fields for modifying revenue growth, tax rates, and discount rates.
- Financial Statements: Detailed annual and quarterly financial data for in-depth analysis.
- Key Ratios: Metrics for profitability, leverage, and efficiency to assess performance.
- Dashboard and Visualizations: Graphical representations of valuation results and underlying assumptions.
Disclaimer
All information, articles, and product details provided on this website are for general informational and educational purposes only. We do not claim any ownership over, nor do we intend to infringe upon, any trademarks, copyrights, logos, brand names, or other intellectual property mentioned or depicted on this site. Such intellectual property remains the property of its respective owners, and any references here are made solely for identification or informational purposes, without implying any affiliation, endorsement, or partnership.
We make no representations or warranties, express or implied, regarding the accuracy, completeness, or suitability of any content or products presented. Nothing on this website should be construed as legal, tax, investment, financial, medical, or other professional advice. In addition, no part of this site—including articles or product references—constitutes a solicitation, recommendation, endorsement, advertisement, or offer to buy or sell any securities, franchises, or other financial instruments, particularly in jurisdictions where such activity would be unlawful.
All content is of a general nature and may not address the specific circumstances of any individual or entity. It is not a substitute for professional advice or services. Any actions you take based on the information provided here are strictly at your own risk. You accept full responsibility for any decisions or outcomes arising from your use of this website and agree to release us from any liability in connection with your use of, or reliance upon, the content or products found herein.