
|
DTE Energy Company 2021 Serie (DTG) DCF Valoración |
Completamente Editable: Adáptelo A Sus Necesidades En Excel O Sheets
Diseño Profesional: Plantillas Confiables Y Estándares De La Industria
Predeterminadas Para Un Uso Rápido Y Eficiente
Compatible con MAC / PC, completamente desbloqueado
No Se Necesita Experiencia; Fáciles De Seguir
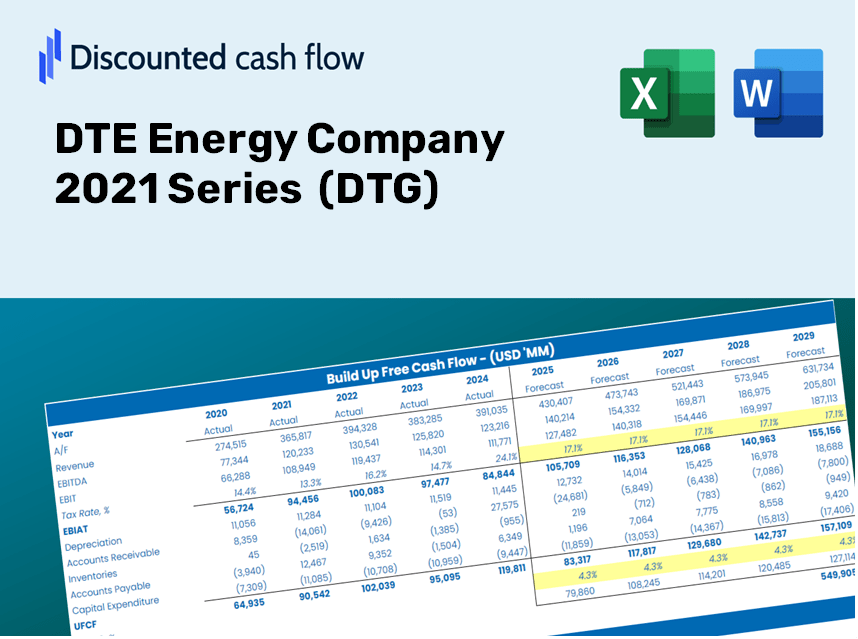
DTE Energy Company 2021 Series (DTG) Bundle
¡Valoración de la serie DTE Energy Company 2021 (DTG) con esta calculadora DCF personalizable! Con la serie Real DTE Energy Company 2021 (DTG) financieras y entradas de pronóstico ajustables, puede explorar escenarios y descubrir el valor razonable de la serie DTE Energy Company 2021 (DTG) en solo minutos.
What You Will Receive
- Authentic DTE Financial Data: Pre-loaded with DTE Energy Company’s historical and projected figures for accurate assessments.
- Completely Customizable Template: Easily adjust key parameters such as revenue growth, WACC, and EBITDA %.
- Instant Calculations: Watch DTE’s intrinsic value update in real-time as you make adjustments.
- Advanced Valuation Tool: Crafted for investors, analysts, and consultants who require precise DCF analysis.
- Intuitive User Interface: Straightforward layout and clear guidelines suitable for users of all skill levels.
Key Features
- Accurate Financial Data: Gain access to precise pre-loaded historical financials and future forecasts for DTE Energy Company 2021 Series (DTG).
- Customizable Assumptions: Modify highlighted cells for parameters such as WACC, growth rates, and profit margins.
- Real-Time Calculations: Automatic adjustments to DCF, Net Present Value (NPV), and cash flow evaluations.
- User-Friendly Dashboard: Intuitive charts and summaries to help you easily interpret valuation outcomes.
- Designed for All Users: An accessible and straightforward layout suitable for investors, CFOs, and consultants alike.
How It Works
- Step 1: Download the Excel file for DTE Energy Company 2021 Series (DTG).
- Step 2: Examine the pre-filled financial data and forecasts for DTE Energy.
- Step 3: Adjust key inputs such as revenue growth, WACC, and tax rates (highlighted cells).
- Step 4: Observe the DCF model refresh in real-time as you modify your assumptions.
- Step 5: Evaluate the outputs and leverage the results for your investment decisions.
Why Choose This Calculator for DTE Energy (DTG)?
- User-Friendly Interface: Designed to cater to both novices and seasoned professionals.
- Customizable Inputs: Easily adjust parameters to suit your analytical needs.
- Real-Time Adjustments: Instantly view how changes impact DTE Energy’s valuation.
- Pre-Loaded Data: Comes equipped with DTE Energy's latest financial information for swift analysis.
- Relied Upon by Experts: A go-to tool for investors and analysts seeking reliable insights.
Who Can Benefit from This Product?
- Investors: Evaluate DTE Energy's valuation before making stock transactions.
- CFOs and Financial Analysts: Enhance valuation processes and validate financial forecasts.
- Startup Founders: Discover how established companies like DTE Energy are appraised.
- Consultants: Provide detailed valuation reports for their clients.
- Students and Educators: Utilize real-world examples to practice and teach valuation methodologies.
Contents of the Template
- Historical Data: Contains DTE Energy's past financial performance and baseline forecasts.
- DCF and Levered DCF Models: Comprehensive templates for assessing the intrinsic value of DTE Energy Company (DTG).
- WACC Sheet: Pre-configured calculations for the Weighted Average Cost of Capital.
- Editable Inputs: Adjust key variables such as growth rates, EBITDA percentages, and CAPEX assumptions.
- Quarterly and Annual Statements: A thorough analysis of DTE Energy's financial data.
- Interactive Dashboard: Dynamic visualization of valuation outcomes and forecasts.
Disclaimer
All information, articles, and product details provided on this website are for general informational and educational purposes only. We do not claim any ownership over, nor do we intend to infringe upon, any trademarks, copyrights, logos, brand names, or other intellectual property mentioned or depicted on this site. Such intellectual property remains the property of its respective owners, and any references here are made solely for identification or informational purposes, without implying any affiliation, endorsement, or partnership.
We make no representations or warranties, express or implied, regarding the accuracy, completeness, or suitability of any content or products presented. Nothing on this website should be construed as legal, tax, investment, financial, medical, or other professional advice. In addition, no part of this site—including articles or product references—constitutes a solicitation, recommendation, endorsement, advertisement, or offer to buy or sell any securities, franchises, or other financial instruments, particularly in jurisdictions where such activity would be unlawful.
All content is of a general nature and may not address the specific circumstances of any individual or entity. It is not a substitute for professional advice or services. Any actions you take based on the information provided here are strictly at your own risk. You accept full responsibility for any decisions or outcomes arising from your use of this website and agree to release us from any liability in connection with your use of, or reliance upon, the content or products found herein.