
|
Valoración DCF de DZS Inc. (DZSI) |
Completamente Editable: Adáptelo A Sus Necesidades En Excel O Sheets
Diseño Profesional: Plantillas Confiables Y Estándares De La Industria
Predeterminadas Para Un Uso Rápido Y Eficiente
Compatible con MAC / PC, completamente desbloqueado
No Se Necesita Experiencia; Fáciles De Seguir
DZS Inc. (DZSI) Bundle
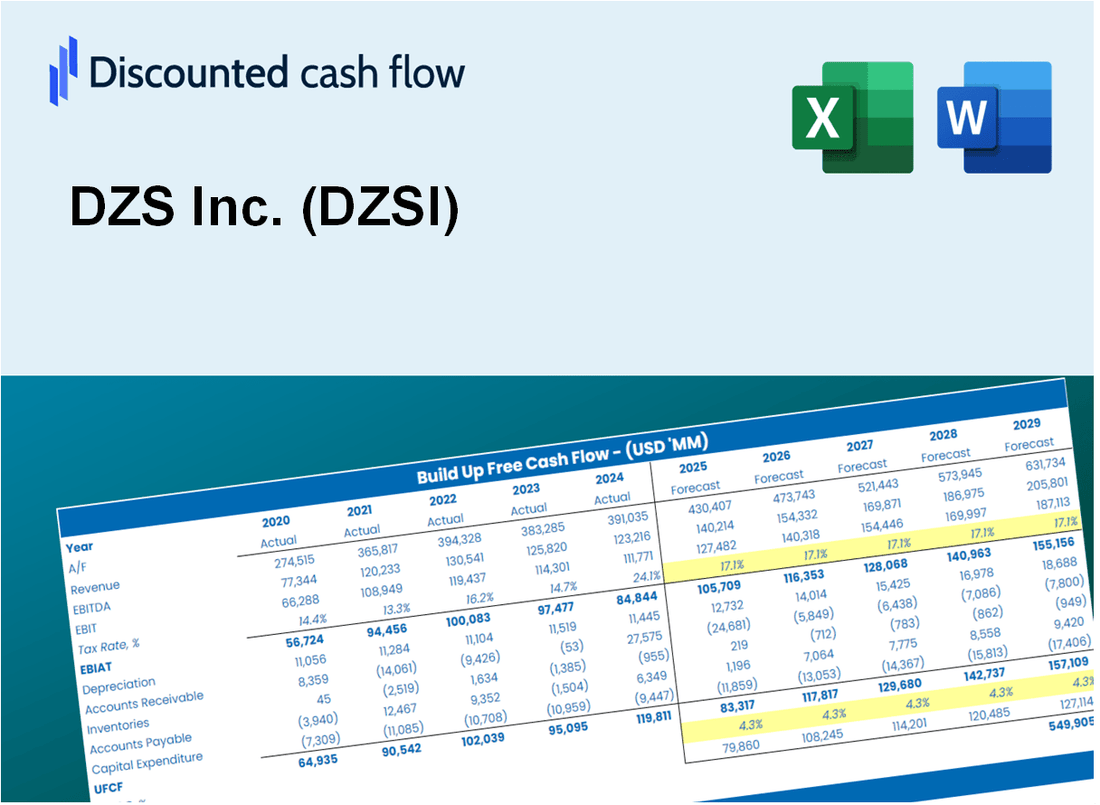
¡Obtenga información sobre su análisis de valoración de DZS Inc. (DZSI) con nuestra calculadora DCF de última generación! Esta plantilla de Excel viene precargada con datos reales de DZSI, lo que le permite ajustar los pronósticos y supuestos para determinar con precisión el valor intrínseco de DZS Inc.
Discounted Cash Flow (DCF) - (USD MM)
| Year | AY1 2019 |
AY2 2020 |
AY3 2021 |
AY4 2022 |
AY5 2023 |
FY1 2024 |
FY2 2025 |
FY3 2026 |
FY4 2027 |
FY5 2028 |
|---|---|---|---|---|---|---|---|---|---|---|
| Revenue | 306.9 | 300.6 | 350.2 | 375.7 | 244.5 | 236.5 | 228.7 | 221.2 | 213.9 | 206.8 |
| Revenue Growth, % | 0 | -2.03 | 16.49 | 7.28 | -34.91 | -3.29 | -3.29 | -3.29 | -3.29 | -3.29 |
| EBITDA | 4.0 | -12.5 | -14.2 | -30.4 | -121.9 | -30.7 | -29.7 | -28.7 | -27.7 | -26.8 |
| EBITDA, % | 1.3 | -4.17 | -4.06 | -8.1 | -49.84 | -12.97 | -12.97 | -12.97 | -12.97 | -12.97 |
| Depreciation | 5.1 | 5.1 | 4.4 | 8.4 | 8.6 | 4.9 | 4.7 | 4.6 | 4.4 | 4.3 |
| Depreciation, % | 1.67 | 1.71 | 1.25 | 2.24 | 3.5 | 2.08 | 2.08 | 2.08 | 2.08 | 2.08 |
| EBIT | -1.1 | -17.7 | -18.6 | -38.9 | -130.4 | -35.6 | -34.4 | -33.3 | -32.2 | -31.1 |
| EBIT, % | -0.36431 | -5.88 | -5.31 | -10.34 | -53.34 | -15.05 | -15.05 | -15.05 | -15.05 | -15.05 |
| Total Cash | 33.4 | 45.2 | 46.7 | 38.3 | 19.0 | 27.1 | 26.2 | 25.3 | 24.5 | 23.7 |
| Total Cash, percent | .0 | .0 | .0 | .0 | .0 | .0 | .0 | .0 | .0 | .0 |
| Account Receivables | 121.7 | 112.6 | 98.9 | 151.2 | 84.5 | 85.2 | 82.4 | 79.7 | 77.1 | 74.5 |
| Account Receivables, % | 39.65 | 37.45 | 28.25 | 40.24 | 34.56 | 36.03 | 36.03 | 36.03 | 36.03 | 36.03 |
| Inventories | 35.4 | 39.6 | 56.9 | 78.5 | 82.2 | 45.2 | 43.7 | 42.2 | 40.8 | 39.5 |
| Inventories, % | 11.55 | 13.16 | 16.25 | 20.9 | 33.63 | 19.1 | 19.1 | 19.1 | 19.1 | 19.1 |
| Accounts Payable | 41.6 | 49.3 | 64.3 | 121.2 | 83.9 | 54.3 | 52.5 | 50.8 | 49.1 | 47.5 |
| Accounts Payable, % | 13.55 | 16.38 | 18.35 | 32.27 | 34.31 | 22.97 | 22.97 | 22.97 | 22.97 | 22.97 |
| Capital Expenditure | -2.3 | -2.3 | -5.6 | -4.5 | -1.6 | -2.3 | -2.3 | -2.2 | -2.1 | -2.0 |
| Capital Expenditure, % | -0.75404 | -0.75506 | -1.59 | -1.21 | -0.64365 | -0.99077 | -0.99077 | -0.99077 | -0.99077 | -0.99077 |
| Tax Rate, % | -0.57944 | -0.57944 | -0.57944 | -0.57944 | -0.57944 | -0.57944 | -0.57944 | -0.57944 | -0.57944 | -0.57944 |
| EBITAT | -1.5 | -20.8 | -20.5 | -41.1 | -131.2 | -35.6 | -34.4 | -33.3 | -32.2 | -31.1 |
| Depreciation | ||||||||||
| Changes in Account Receivables | ||||||||||
| Changes in Inventories | ||||||||||
| Changes in Accounts Payable | ||||||||||
| Capital Expenditure | ||||||||||
| UFCF | -114.3 | -5.4 | -10.3 | -54.1 | -98.6 | -26.2 | -29.4 | -28.5 | -27.5 | -26.6 |
| WACC, % | 5.96 | 5.96 | 5.96 | 5.96 | 5.96 | 5.96 | 5.96 | 5.96 | 5.96 | 5.96 |
| PV UFCF | ||||||||||
| SUM PV UFCF | -116.6 | |||||||||
| Long Term Growth Rate, % | 2.00 | |||||||||
| Free cash flow (T + 1) | -27 | |||||||||
| Terminal Value | -685 | |||||||||
| Present Terminal Value | -513 | |||||||||
| Enterprise Value | -630 | |||||||||
| Net Debt | 49 | |||||||||
| Equity Value | -678 | |||||||||
| Diluted Shares Outstanding, MM | 32 | |||||||||
| Equity Value Per Share | -21.50 |
What You Will Get
- Real DZSI Financial Data: Pre-filled with DZS Inc.'s historical and projected data for precise analysis.
- Fully Editable Template: Modify key inputs like revenue growth, WACC, and EBITDA % with ease.
- Automatic Calculations: See DZS Inc.'s intrinsic value update instantly based on your changes.
- Professional Valuation Tool: Designed for investors, analysts, and consultants seeking accurate DCF results.
- User-Friendly Design: Simple structure and clear instructions for all experience levels.
Key Features
- Comprehensive DZS Financial Data: Gain access to reliable pre-loaded historical figures and future estimates.
- Adjustable Forecast Parameters: Modify yellow-highlighted fields such as WACC, growth rates, and profit margins.
- Real-Time Calculations: Automatic recalculations for DCF, Net Present Value (NPV), and cash flow assessments.
- User-Friendly Dashboard: Intuitive charts and summaries to help you visualize your valuation findings.
- Designed for All Skill Levels: A straightforward, user-friendly layout tailored for investors, CFOs, and consultants.
How It Works
- Step 1: Download the Excel file for DZS Inc. (DZSI).
- Step 2: Review DZS Inc.'s pre-filled financial data and forecasts.
- Step 3: Modify key inputs such as revenue growth, WACC, and tax rates (highlighted cells).
- Step 4: Observe the DCF model update in real-time as you adjust assumptions.
- Step 5: Analyze the outputs and leverage the results for your investment decisions.
Why Choose the DZS Inc. (DZSI) Calculator?
- Accuracy: Utilizes real DZS Inc. financials for precise data.
- Flexibility: Tailored for users to experiment and adjust inputs effortlessly.
- Time-Saving: Avoid the complexities of constructing a DCF model from the ground up.
- Professional-Grade: Crafted with the precision and usability standards expected by CFOs.
- User-Friendly: Intuitive design makes it accessible for users without extensive financial modeling skills.
Who Should Use DZS Inc. (DZSI) Products?
- Telecommunications Professionals: Develop robust network solutions to enhance service delivery.
- Corporate Strategy Teams: Evaluate market trends to inform business decisions.
- Industry Consultants: Offer clients expert insights on DZS Inc. (DZSI) technology and services.
- Students and Instructors: Utilize current industry data to learn and teach about telecom innovations.
- Tech Investors: Gain understanding of how DZS Inc. (DZSI) fits into the broader tech landscape.
What the Template Contains
- Preloaded DZSI Data: Historical and projected financial metrics, including revenue, EBIT, and capital expenditures.
- DCF and WACC Models: Advanced sheets designed for calculating intrinsic value and Weighted Average Cost of Capital.
- Editable Inputs: Yellow-highlighted cells for modifying revenue growth, tax rates, and discount rates.
- Financial Statements: Detailed annual and quarterly financials for in-depth analysis.
- Key Ratios: Profitability, leverage, and efficiency ratios to assess performance.
- Dashboard and Charts: Visual representations of valuation outcomes and underlying assumptions.
Disclaimer
All information, articles, and product details provided on this website are for general informational and educational purposes only. We do not claim any ownership over, nor do we intend to infringe upon, any trademarks, copyrights, logos, brand names, or other intellectual property mentioned or depicted on this site. Such intellectual property remains the property of its respective owners, and any references here are made solely for identification or informational purposes, without implying any affiliation, endorsement, or partnership.
We make no representations or warranties, express or implied, regarding the accuracy, completeness, or suitability of any content or products presented. Nothing on this website should be construed as legal, tax, investment, financial, medical, or other professional advice. In addition, no part of this site—including articles or product references—constitutes a solicitation, recommendation, endorsement, advertisement, or offer to buy or sell any securities, franchises, or other financial instruments, particularly in jurisdictions where such activity would be unlawful.
All content is of a general nature and may not address the specific circumstances of any individual or entity. It is not a substitute for professional advice or services. Any actions you take based on the information provided here are strictly at your own risk. You accept full responsibility for any decisions or outcomes arising from your use of this website and agree to release us from any liability in connection with your use of, or reliance upon, the content or products found herein.