
|
Valoración DCF de eFFECTOR Therapeutics, Inc. (EFTR) |
Completamente Editable: Adáptelo A Sus Necesidades En Excel O Sheets
Diseño Profesional: Plantillas Confiables Y Estándares De La Industria
Predeterminadas Para Un Uso Rápido Y Eficiente
Compatible con MAC / PC, completamente desbloqueado
No Se Necesita Experiencia; Fáciles De Seguir
eFFECTOR Therapeutics, Inc. (EFTR) Bundle
¡Explore Effector Therapeutics, Inc. (EFTR) Outlook financiero con nuestra calculadora DCF fácil de usar! Ingrese sus proyecciones para el crecimiento, los márgenes y los gastos para determinar el valor intrínseco de Effector Therapeutics, Inc. (EFTR) e informar su enfoque de inversión.
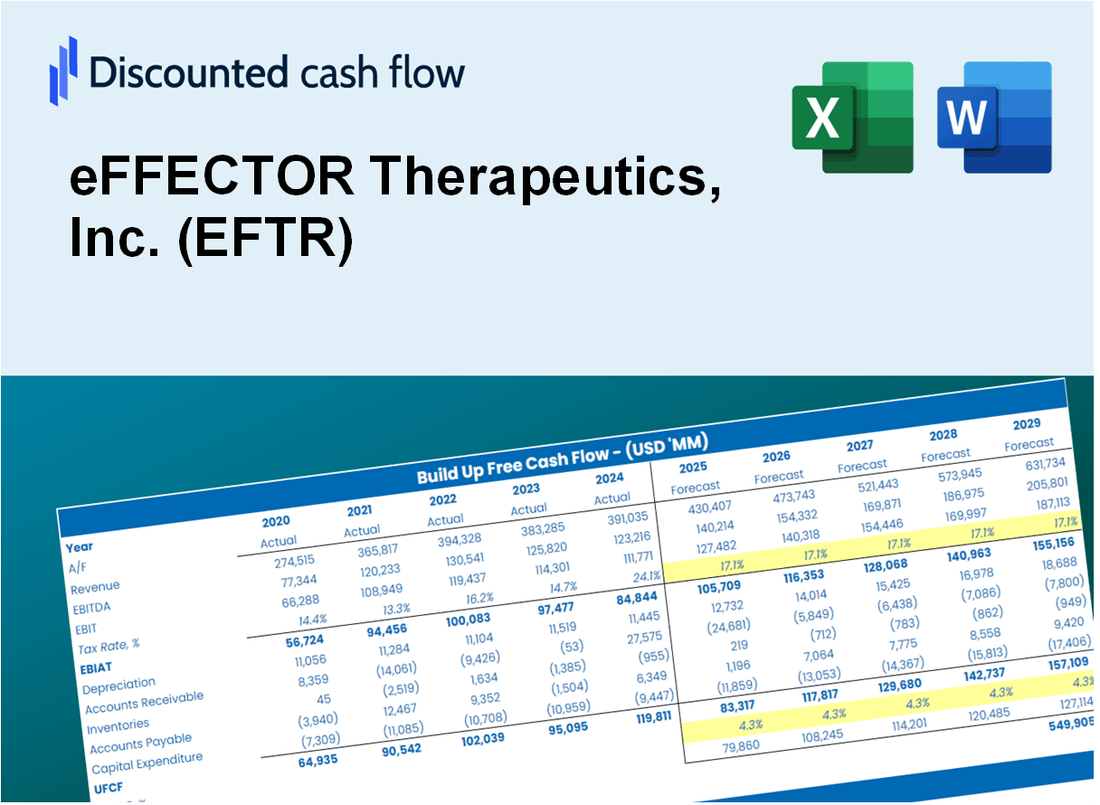
Discounted Cash Flow (DCF) - (USD MM)
| Year | AY1 2019 |
AY2 2020 |
AY3 2021 |
AY4 2022 |
AY5 2023 |
FY1 2024 |
FY2 2025 |
FY3 2026 |
FY4 2027 |
FY5 2028 |
|---|---|---|---|---|---|---|---|---|---|---|
| Revenue | .0 | 42.0 | 1.4 | 3.6 | .0 | .0 | .0 | .0 | .0 | .0 |
| Revenue Growth, % | 0 | 0 | -96.6 | 148.46 | -100 | -24.15 | -24.15 | -24.15 | -24.15 | -24.15 |
| EBITDA | -28.1 | 16.1 | 17.6 | -20.4 | -32.8 | .0 | .0 | .0 | .0 | .0 |
| EBITDA, % | 100 | 38.23 | 1229.79 | -573.07 | 100 | 47.65 | 47.65 | 47.65 | 47.65 | 47.65 |
| Depreciation | .3 | .2 | .0 | .1 | .1 | .0 | .0 | .0 | .0 | .0 |
| Depreciation, % | 100 | 0.38095 | 1.68 | 1.49 | 100 | 40.71 | 40.71 | 40.71 | 40.71 | 40.71 |
| EBIT | -28.4 | 15.9 | 17.6 | -20.4 | -32.9 | .0 | .0 | .0 | .0 | .0 |
| EBIT, % | 100 | 37.85 | 1228.11 | -574.56 | 100 | 47.57 | 47.57 | 47.57 | 47.57 | 47.57 |
| Total Cash | 3.4 | 15.2 | 49.7 | 26.3 | 18.4 | .0 | .0 | .0 | .0 | .0 |
| Total Cash, percent | .0 | .0 | .0 | .0 | .0 | .0 | .0 | .0 | .0 | .0 |
| Account Receivables | .0 | .0 | .1 | .0 | .1 | .0 | .0 | .0 | .0 | .0 |
| Account Receivables, % | 100 | 0 | 6.99 | 0.75992 | 100 | 41.55 | 41.55 | 41.55 | 41.55 | 41.55 |
| Inventories | .0 | .0 | -.1 | .0 | .0 | .0 | .0 | .0 | .0 | .0 |
| Inventories, % | 100 | 0 | -6.99 | -0.75992 | 100 | 38.45 | 38.45 | 38.45 | 38.45 | 38.45 |
| Accounts Payable | .6 | .3 | .5 | 1.5 | 2.3 | .0 | .0 | .0 | .0 | .0 |
| Accounts Payable, % | 100 | 0.82619 | 36.08 | 41.82 | 100 | 55.75 | 55.75 | 55.75 | 55.75 | 55.75 |
| Capital Expenditure | .0 | -.2 | .0 | -.2 | -.1 | .0 | .0 | .0 | .0 | .0 |
| Capital Expenditure, % | 100 | -0.36667 | -2.94 | -5.4 | 100 | -1.74 | -1.74 | -1.74 | -1.74 | -1.74 |
| Tax Rate, % | 0 | 0 | 0 | 0 | 0 | 0 | 0 | 0 | 0 | 0 |
| EBITAT | -28.4 | 15.5 | 17.6 | -11.6 | -32.9 | .0 | .0 | .0 | .0 | .0 |
| Depreciation | ||||||||||
| Changes in Account Receivables | ||||||||||
| Changes in Inventories | ||||||||||
| Changes in Accounts Payable | ||||||||||
| Capital Expenditure | ||||||||||
| UFCF | -27.5 | 15.3 | 17.7 | -10.8 | -32.1 | -2.3 | .0 | .0 | .0 | .0 |
| WACC, % | 3.74 | 3.65 | 3.74 | 2.13 | 3.74 | 3.4 | 3.4 | 3.4 | 3.4 | 3.4 |
| PV UFCF | ||||||||||
| SUM PV UFCF | -2.2 | |||||||||
| Long Term Growth Rate, % | 2.00 | |||||||||
| Free cash flow (T + 1) | 0 | |||||||||
| Terminal Value | 0 | |||||||||
| Present Terminal Value | 0 | |||||||||
| Enterprise Value | -2 | |||||||||
| Net Debt | 6 | |||||||||
| Equity Value | -8 | |||||||||
| Diluted Shares Outstanding, MM | 2 | |||||||||
| Equity Value Per Share | -3.60 |
What You Will Get
- Pre-Filled Financial Model: eFFECTOR Therapeutics’ actual data enables precise DCF valuation.
- Full Forecast Control: Adjust revenue growth, margins, WACC, and other key drivers for [EFTR].
- Instant Calculations: Automatic updates ensure you see results as you make changes to the [EFTR] model.
- Investor-Ready Template: A refined Excel file designed for professional-grade valuation of [EFTR].
- Customizable and Reusable: Tailored for flexibility, allowing repeated use for detailed forecasts on [EFTR].
Key Features
- Customizable Clinical Parameters: Adjust essential inputs such as treatment efficacy, patient demographics, and market penetration.
- Instant DCF Valuation: Quickly computes intrinsic value, NPV, and other financial metrics.
- Industry-Leading Precision: Incorporates eFFECTOR Therapeutics’ real-world data for accurate valuation results.
- Effortless Scenario Analysis: Evaluate various hypotheses and analyze results with ease.
- Efficiency Booster: Remove the hassle of constructing intricate valuation models from the ground up.
How It Works
- Download the Template: Gain immediate access to the Excel-based eFFECTOR Therapeutics DCF Calculator.
- Input Your Assumptions: Modify the yellow-highlighted cells for growth rates, WACC, margins, and other key inputs.
- Instant Calculations: The model automatically recalculates the intrinsic value of eFFECTOR Therapeutics (EFTR).
- Test Scenarios: Experiment with various assumptions to assess potential changes in valuation.
- Analyze and Decide: Leverage the results to inform your investment or financial analysis decisions.
Why Choose eFFECTOR Therapeutics, Inc. (EFTR) Calculator?
- Designed for Experts: A sophisticated tool tailored for researchers, investors, and healthcare analysts.
- Comprehensive Data: eFFECTOR’s historical and projected financials integrated for precise analysis.
- Flexible Scenario Analysis: Effortlessly test various outcomes and assumptions.
- Insightful Outputs: Automatically computes intrinsic value, NPV, and essential financial metrics.
- User-Friendly: Step-by-step guidance ensures a smooth user experience.
Who Should Use This Product?
- Pharmaceutical Researchers: Explore innovative therapeutic approaches and evaluate their potential using real-world data.
- Healthcare Academics: Integrate advanced models into educational programs or scholarly research.
- Investors: Analyze your investment strategies and assess the valuation metrics for eFFECTOR Therapeutics, Inc. (EFTR).
- Market Analysts: Enhance your analysis with a customizable financial model tailored to biotech firms.
- Entrepreneurs in Biotech: Understand how established companies like eFFECTOR Therapeutics, Inc. (EFTR) are valued in the market.
What the Template Contains
- Preloaded EFTR Data: Historical and projected financial data, including revenue, EBIT, and capital expenditures.
- DCF and WACC Models: Professional-grade sheets for calculating intrinsic value and Weighted Average Cost of Capital.
- Editable Inputs: Yellow-highlighted cells for adjusting revenue growth, tax rates, and discount rates.
- Financial Statements: Comprehensive annual and quarterly financials for deeper analysis.
- Key Ratios: Profitability, leverage, and efficiency ratios to evaluate performance.
- Dashboard and Charts: Visual summaries of valuation outcomes and assumptions.
Disclaimer
All information, articles, and product details provided on this website are for general informational and educational purposes only. We do not claim any ownership over, nor do we intend to infringe upon, any trademarks, copyrights, logos, brand names, or other intellectual property mentioned or depicted on this site. Such intellectual property remains the property of its respective owners, and any references here are made solely for identification or informational purposes, without implying any affiliation, endorsement, or partnership.
We make no representations or warranties, express or implied, regarding the accuracy, completeness, or suitability of any content or products presented. Nothing on this website should be construed as legal, tax, investment, financial, medical, or other professional advice. In addition, no part of this site—including articles or product references—constitutes a solicitation, recommendation, endorsement, advertisement, or offer to buy or sell any securities, franchises, or other financial instruments, particularly in jurisdictions where such activity would be unlawful.
All content is of a general nature and may not address the specific circumstances of any individual or entity. It is not a substitute for professional advice or services. Any actions you take based on the information provided here are strictly at your own risk. You accept full responsibility for any decisions or outcomes arising from your use of this website and agree to release us from any liability in connection with your use of, or reliance upon, the content or products found herein.