
|
Valoración DCF de eGain Corporation (EGAN) |
Completamente Editable: Adáptelo A Sus Necesidades En Excel O Sheets
Diseño Profesional: Plantillas Confiables Y Estándares De La Industria
Predeterminadas Para Un Uso Rápido Y Eficiente
Compatible con MAC / PC, completamente desbloqueado
No Se Necesita Experiencia; Fáciles De Seguir
eGain Corporation (EGAN) Bundle
¡Mejore sus estrategias de inversión con la calculadora DCF de Egain Corporation (EGAN)! Utilice datos financieros reales de Egain, ajuste las proyecciones y gastos de crecimiento, y observe cómo estas modificaciones afectan el valor intrínseco de Egain Corporation (EGAN) en tiempo real.
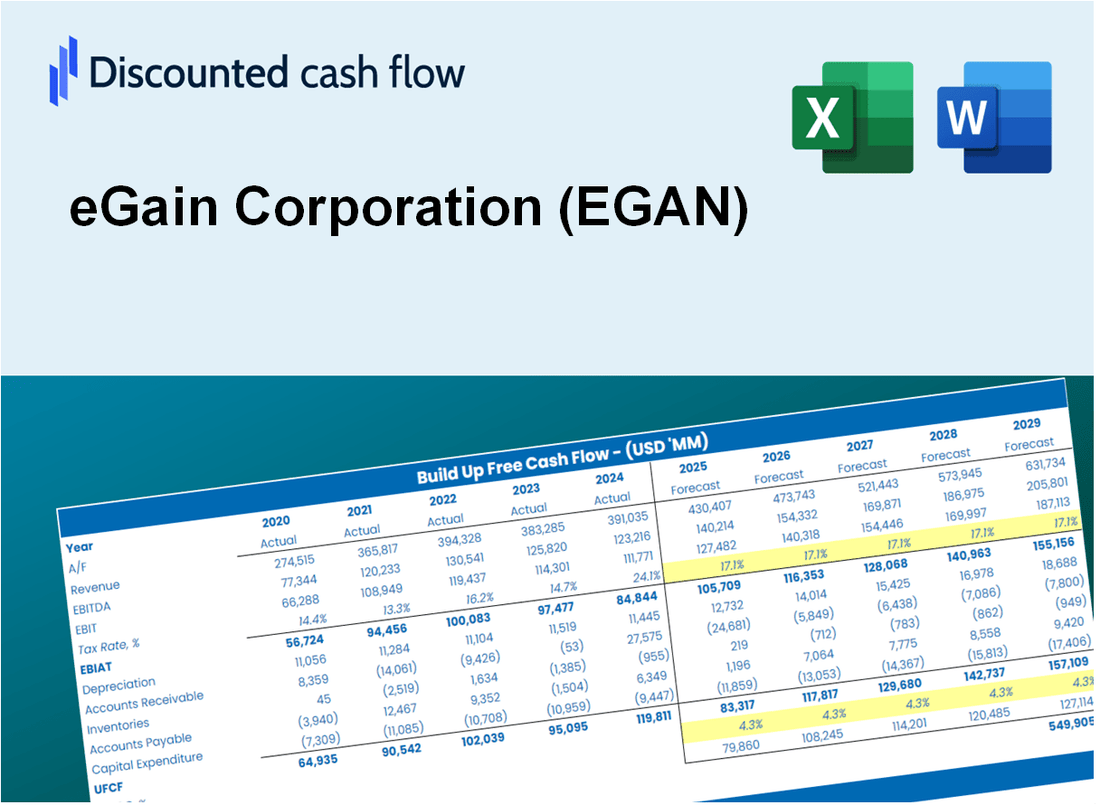
Discounted Cash Flow (DCF) - (USD MM)
| Year | AY1 2021 |
AY2 2022 |
AY3 2023 |
AY4 2024 |
AY5 2025 |
FY1 2026 |
FY2 2027 |
FY3 2028 |
FY4 2029 |
FY5 2030 |
|---|---|---|---|---|---|---|---|---|---|---|
| Revenue | 78.3 | 92.0 | 98.0 | 92.8 | 88.4 | 88.4 | 88.3 | 88.3 | 88.3 | 88.2 |
| Revenue Growth, % | 0 | 17.45 | 6.59 | -5.31 | -4.71 | -0.04853483 | -0.04853483 | -0.04853483 | -0.04853483 | -0.04853483 |
| EBITDA | 9.4 | -.6 | 3.0 | 7.5 | 6.0 | 5.2 | 5.2 | 5.2 | 5.2 | 5.2 |
| EBITDA, % | 12.04 | -0.66775 | 3.08 | 8.03 | 6.76 | 5.85 | 5.85 | 5.85 | 5.85 | 5.85 |
| Depreciation | 2.1 | 1.5 | 1.6 | 1.5 | .3 | 1.4 | 1.4 | 1.4 | 1.4 | 1.4 |
| Depreciation, % | 2.67 | 1.66 | 1.67 | 1.6 | 0.38448 | 1.6 | 1.6 | 1.6 | 1.6 | 1.6 |
| EBIT | 7.3 | -2.1 | 1.4 | 6.0 | 5.6 | 3.8 | 3.8 | 3.8 | 3.8 | 3.8 |
| EBIT, % | 9.37 | -2.33 | 1.42 | 6.43 | 6.37 | 4.26 | 4.26 | 4.26 | 4.26 | 4.26 |
| Total Cash | 63.2 | 72.2 | 73.2 | 70.0 | 62.9 | 67.3 | 67.2 | 67.2 | 67.2 | 67.1 |
| Total Cash, percent | .0 | .0 | .0 | .0 | .0 | .0 | .0 | .0 | .0 | .0 |
| Account Receivables | 26.3 | 27.0 | 31.6 | 31.7 | 32.8 | 29.4 | 29.4 | 29.4 | 29.4 | 29.4 |
| Account Receivables, % | 33.61 | 29.32 | 32.21 | 34.19 | 37.06 | 33.28 | 33.28 | 33.28 | 33.28 | 33.28 |
| Inventories | .0 | .0 | .0 | .0 | .0 | .0 | .0 | .0 | .0 | .0 |
| Inventories, % | 0 | 0 | 0 | 0 | 0 | 0 | 0 | 0 | 0 | 0 |
| Accounts Payable | 3.1 | 1.7 | 2.0 | 2.7 | 2.6 | 2.4 | 2.4 | 2.4 | 2.4 | 2.4 |
| Accounts Payable, % | 3.92 | 1.86 | 2.09 | 2.94 | 2.94 | 2.75 | 2.75 | 2.75 | 2.75 | 2.75 |
| Capital Expenditure | -.4 | -.6 | -.3 | -.2 | -.6 | -.4 | -.4 | -.4 | -.4 | -.4 |
| Capital Expenditure, % | -0.5135 | -0.68297 | -0.29384 | -0.21336 | -0.63892 | -0.46852 | -0.46852 | -0.46852 | -0.46852 | -0.46852 |
| Tax Rate, % | -472.18 | -472.18 | -472.18 | -472.18 | -472.18 | -472.18 | -472.18 | -472.18 | -472.18 | -472.18 |
| EBITAT | 7.5 | -4.3 | .9 | 4.8 | 32.3 | 3.3 | 3.3 | 3.3 | 3.3 | 3.3 |
| Depreciation | ||||||||||
| Changes in Account Receivables | ||||||||||
| Changes in Inventories | ||||||||||
| Changes in Accounts Payable | ||||||||||
| Capital Expenditure | ||||||||||
| UFCF | -14.0 | -5.4 | -2.1 | 6.6 | 30.9 | 7.5 | 4.3 | 4.3 | 4.3 | 4.3 |
| WACC, % | 7.44 | 7.44 | 7.43 | 7.44 | 7.44 | 7.44 | 7.44 | 7.44 | 7.44 | 7.44 |
| PV UFCF | ||||||||||
| SUM PV UFCF | 20.5 | |||||||||
| Long Term Growth Rate, % | 4.00 | |||||||||
| Free cash flow (T + 1) | 5 | |||||||||
| Terminal Value | 131 | |||||||||
| Present Terminal Value | 91 | |||||||||
| Enterprise Value | 112 | |||||||||
| Net Debt | -59 | |||||||||
| Equity Value | 171 | |||||||||
| Diluted Shares Outstanding, MM | 29 | |||||||||
| Equity Value Per Share | 5.98 |
What You Will Get
- Real eGain Data: Preloaded financials – encompassing revenue to EBIT – based on actual and projected figures.
- Full Customization: Modify all essential parameters (yellow cells) such as WACC, growth %, and tax rates.
- Instant Valuation Updates: Automatic recalculations to assess the effect of changes on eGain’s fair value.
- Versatile Excel Template: Designed for quick edits, scenario testing, and comprehensive projections.
- Time-Saving and Accurate: Avoid the hassle of building models from scratch while ensuring precision and flexibility.
Key Features
- Pre-Loaded Data: eGain Corporation's historical financial statements and pre-filled forecasts.
- Fully Adjustable Inputs: Customize WACC, tax rates, revenue growth, and EBITDA margins.
- Instant Results: Observe eGain Corporation's intrinsic value recalculating in real time.
- Clear Visual Outputs: Dashboard charts illustrate valuation results and key metrics.
- Built for Accuracy: A professional tool designed for analysts, investors, and finance experts.
How It Works
- Step 1: Download the prebuilt Excel template featuring eGain Corporation’s (EGAN) data.
- Step 2: Review the pre-filled sheets to familiarize yourself with the essential metrics.
- Step 3: Modify forecasts and assumptions in the editable yellow cells (WACC, growth, margins).
- Step 4: Instantly see the recalculated results, including eGain Corporation’s intrinsic value.
- Step 5: Make well-informed investment decisions or create reports based on the outputs.
Why Choose This Calculator for eGain Corporation (EGAN)?
- Accuracy: Utilizes real eGain financial data to ensure precise calculations.
- Flexibility: Allows users to easily test and adjust inputs as needed.
- Time-Saving: Eliminates the need to create a DCF model from the ground up.
- Professional-Grade: Crafted with the expertise and precision expected at the CFO level.
- User-Friendly: Intuitive design makes it accessible for users without advanced financial modeling skills.
Who Should Use eGain Corporation (EGAN)?
- Professional Investors: Develop comprehensive and accurate valuation models for investment analysis.
- Corporate Finance Teams: Evaluate valuation scenarios to inform strategic decisions.
- Consultants and Advisors: Deliver precise valuation insights for eGain Corporation (EGAN) to clients.
- Students and Educators: Leverage real-world data to enhance financial modeling skills and education.
- Tech Enthusiasts: Gain insights into how tech companies like eGain Corporation (EGAN) are valued in the industry.
What the Template Contains
- Pre-Filled Data: Includes eGain Corporation's historical financials and forecasts.
- Discounted Cash Flow Model: Editable DCF valuation model with automatic calculations.
- Weighted Average Cost of Capital (WACC): A dedicated sheet for calculating WACC based on custom inputs.
- Key Financial Ratios: Analyze eGain Corporation's profitability, efficiency, and leverage.
- Customizable Inputs: Edit revenue growth, margins, and tax rates with ease.
- Clear Dashboard: Charts and tables summarizing key valuation results.
Disclaimer
All information, articles, and product details provided on this website are for general informational and educational purposes only. We do not claim any ownership over, nor do we intend to infringe upon, any trademarks, copyrights, logos, brand names, or other intellectual property mentioned or depicted on this site. Such intellectual property remains the property of its respective owners, and any references here are made solely for identification or informational purposes, without implying any affiliation, endorsement, or partnership.
We make no representations or warranties, express or implied, regarding the accuracy, completeness, or suitability of any content or products presented. Nothing on this website should be construed as legal, tax, investment, financial, medical, or other professional advice. In addition, no part of this site—including articles or product references—constitutes a solicitation, recommendation, endorsement, advertisement, or offer to buy or sell any securities, franchises, or other financial instruments, particularly in jurisdictions where such activity would be unlawful.
All content is of a general nature and may not address the specific circumstances of any individual or entity. It is not a substitute for professional advice or services. Any actions you take based on the information provided here are strictly at your own risk. You accept full responsibility for any decisions or outcomes arising from your use of this website and agree to release us from any liability in connection with your use of, or reliance upon, the content or products found herein.