
|
Elis SA (Elis.PA) DCF Valoración |
Completamente Editable: Adáptelo A Sus Necesidades En Excel O Sheets
Diseño Profesional: Plantillas Confiables Y Estándares De La Industria
Predeterminadas Para Un Uso Rápido Y Eficiente
Compatible con MAC / PC, completamente desbloqueado
No Se Necesita Experiencia; Fáciles De Seguir
Elis SA (ELIS.PA) Bundle
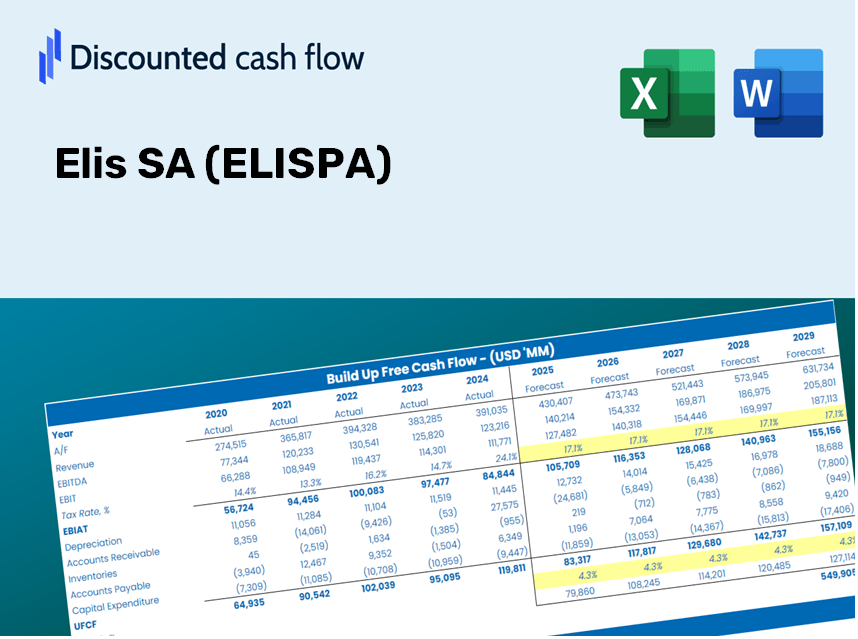
¡Optimice su tiempo y mejore la precisión con nuestra calculadora DCF (ELISPA)! Equipado con datos reales de Elis SA y supuestos personalizables, esta herramienta le permite pronosticar, analizar y valorar a Elis SA como un inversor experimentado.
Discounted Cash Flow (DCF) - (USD MM)
| Year | AY1 2020 |
AY2 2021 |
AY3 2022 |
AY4 2023 |
AY5 2024 |
FY1 2025 |
FY2 2026 |
FY3 2027 |
FY4 2028 |
FY5 2029 |
|---|---|---|---|---|---|---|---|---|---|---|
| Revenue | 2,806.3 | 3,048.3 | 3,820.9 | 4,309.4 | 4,573.6 | 5,178.3 | 5,862.9 | 6,638.0 | 7,515.7 | 8,509.3 |
| Revenue Growth, % | 0 | 8.62 | 25.35 | 12.78 | 6.13 | 13.22 | 13.22 | 13.22 | 13.22 | 13.22 |
| EBITDA | 866.1 | 1,009.8 | 1,078.8 | 1,263.4 | 1,588.0 | 1,618.3 | 1,832.3 | 2,074.5 | 2,348.8 | 2,659.4 |
| EBITDA, % | 30.86 | 33.13 | 28.23 | 29.32 | 34.72 | 31.25 | 31.25 | 31.25 | 31.25 | 31.25 |
| Depreciation | 750.3 | 745.4 | 695.9 | 761.4 | 963.3 | 1,119.9 | 1,267.9 | 1,435.6 | 1,625.4 | 1,840.3 |
| Depreciation, % | 26.74 | 24.45 | 18.21 | 17.67 | 21.06 | 21.63 | 21.63 | 21.63 | 21.63 | 21.63 |
| EBIT | 115.8 | 264.4 | 382.9 | 502.0 | 624.7 | 498.5 | 564.4 | 639.0 | 723.4 | 819.1 |
| EBIT, % | 4.13 | 8.67 | 10.02 | 11.65 | 13.66 | 9.63 | 9.63 | 9.63 | 9.63 | 9.63 |
| Total Cash | 137.6 | 160.0 | 286.2 | 665.1 | 622.1 | 483.4 | 547.3 | 619.7 | 701.6 | 794.4 |
| Total Cash, percent | .0 | .0 | .0 | .0 | .0 | .0 | .0 | .0 | .0 | .0 |
| Account Receivables | 558.2 | 655.9 | 810.2 | 802.6 | 892.4 | 1,043.4 | 1,181.4 | 1,337.5 | 1,514.4 | 1,714.6 |
| Account Receivables, % | 19.89 | 21.52 | 21.2 | 18.62 | 19.51 | 20.15 | 20.15 | 20.15 | 20.15 | 20.15 |
| Inventories | 137.3 | 138.8 | 195.3 | 185.6 | 200.0 | 240.7 | 272.5 | 308.5 | 349.3 | 395.5 |
| Inventories, % | 4.89 | 4.55 | 5.11 | 4.31 | 4.37 | 4.65 | 4.65 | 4.65 | 4.65 | 4.65 |
| Accounts Payable | 193.9 | 9.9 | 326.5 | 355.7 | 391.1 | 337.5 | 382.1 | 432.6 | 489.8 | 554.5 |
| Accounts Payable, % | 6.91 | 0.32477 | 8.55 | 8.25 | 8.55 | 6.52 | 6.52 | 6.52 | 6.52 | 6.52 |
| Capital Expenditure | -499.2 | -573.9 | -699.8 | -823.9 | -887.4 | -967.8 | -1,095.8 | -1,240.7 | -1,404.7 | -1,590.4 |
| Capital Expenditure, % | -17.79 | -18.83 | -18.32 | -19.12 | -19.4 | -18.69 | -18.69 | -18.69 | -18.69 | -18.69 |
| Tax Rate, % | 27.51 | 27.51 | 27.51 | 27.51 | 27.51 | 27.51 | 27.51 | 27.51 | 27.51 | 27.51 |
| EBITAT | 10.5 | 176.6 | 272.1 | 353.4 | 452.8 | 288.9 | 327.1 | 370.4 | 419.4 | 474.8 |
| Depreciation | ||||||||||
| Changes in Account Receivables | ||||||||||
| Changes in Inventories | ||||||||||
| Changes in Accounts Payable | ||||||||||
| Capital Expenditure | ||||||||||
| UFCF | -240.0 | 64.9 | 374.0 | 337.4 | 459.9 | 195.7 | 374.1 | 423.6 | 479.6 | 543.0 |
| WACC, % | 6.78 | 7.63 | 7.69 | 7.68 | 7.71 | 7.5 | 7.5 | 7.5 | 7.5 | 7.5 |
| PV UFCF | ||||||||||
| SUM PV UFCF | 1,584.2 | |||||||||
| Long Term Growth Rate, % | 2.00 | |||||||||
| Free cash flow (T + 1) | 554 | |||||||||
| Terminal Value | 10,074 | |||||||||
| Present Terminal Value | 7,018 | |||||||||
| Enterprise Value | 8,602 | |||||||||
| Net Debt | 3,642 | |||||||||
| Equity Value | 4,960 | |||||||||
| Diluted Shares Outstanding, MM | 261 | |||||||||
| Equity Value Per Share | 19.04 |
What You Will Receive
- Genuine ELISPA Financials: Access to historical and projected data for precise valuation.
- Customizable Inputs: Adjust WACC, tax rates, revenue growth, and capital expenditures as needed.
- Automated Calculations: Intrinsic value and NPV are computed in real-time.
- Scenario Analysis: Evaluate various scenarios to assess Elis SA’s future performance.
- User-Friendly Design: Designed for professionals while remaining approachable for newcomers.
Key Features
- Comprehensive ELIS Data: Comes pre-loaded with Elis SA’s historical financial performance and future projections.
- Customizable Input Options: Tailor revenue growth rates, profit margins, WACC, tax rates, and capital expenditure assumptions.
- Dynamic Valuation Framework: Automatically refreshes Net Present Value (NPV) and intrinsic value based on your specified inputs.
- Scenario Analysis: Develop various forecasting scenarios to evaluate different valuation possibilities.
- Intuitive Interface: Designed to be straightforward, catering to both seasoned professionals and newcomers.
How It Operates
- Step 1: Download the Excel spreadsheet.
- Step 2: Examine the pre-filled data for Elis SA (ELISPA) including historical trends and future projections.
- Step 3: Modify key assumptions (highlighted in yellow) based on your own analysis.
- Step 4: Observe the automatic updates reflecting Elis SA's (ELISPA) intrinsic value.
- Step 5: Utilize the results to guide your investment choices or for reporting purposes.
Why Opt for This Calculator?
- All-in-One Solution: Features DCF, WACC, and financial ratio analyses all in a single tool.
- Adjustable Inputs: Modify the yellow-highlighted cells to explore different scenarios.
- In-Depth Analysis: Automatically computes the intrinsic value and Net Present Value for Elis SA (ELISPA).
- Integrated Data: Includes historical and projected data for reliable starting values.
- Professional Standard: Perfect for financial analysts, investors, and business consultants.
Who Can Benefit from This Product?
- Finance Students: Master valuation techniques and practice with real-world data.
- Scholars: Integrate professional valuation models into your teaching or research projects.
- Investors: Evaluate your own hypotheses and analyze valuation results for Elis SA (ELISPA) stock.
- Market Analysts: Enhance your efficiency with a ready-made, customizable DCF model.
- Entrepreneurs: Understand the valuation approach for large public firms like Elis SA (ELISPA).
Contents of the Template
- Preloaded ELISPA Data: Historical and projected financial information, encompassing revenue, EBIT, and capital expenditures.
- DCF and WACC Models: Professional-grade spreadsheets for assessing intrinsic value and Weighted Average Cost of Capital.
- Editable Inputs: Yellow-highlighted fields for modifying revenue growth, tax rates, and discount rates.
- Financial Statements: Detailed annual and quarterly financials for in-depth analysis.
- Key Ratios: Metrics for profitability, leverage, and efficiency to assess performance.
- Dashboard and Charts: Visual representations of valuation outcomes and underlying assumptions.
Disclaimer
All information, articles, and product details provided on this website are for general informational and educational purposes only. We do not claim any ownership over, nor do we intend to infringe upon, any trademarks, copyrights, logos, brand names, or other intellectual property mentioned or depicted on this site. Such intellectual property remains the property of its respective owners, and any references here are made solely for identification or informational purposes, without implying any affiliation, endorsement, or partnership.
We make no representations or warranties, express or implied, regarding the accuracy, completeness, or suitability of any content or products presented. Nothing on this website should be construed as legal, tax, investment, financial, medical, or other professional advice. In addition, no part of this site—including articles or product references—constitutes a solicitation, recommendation, endorsement, advertisement, or offer to buy or sell any securities, franchises, or other financial instruments, particularly in jurisdictions where such activity would be unlawful.
All content is of a general nature and may not address the specific circumstances of any individual or entity. It is not a substitute for professional advice or services. Any actions you take based on the information provided here are strictly at your own risk. You accept full responsibility for any decisions or outcomes arising from your use of this website and agree to release us from any liability in connection with your use of, or reliance upon, the content or products found herein.