
|
Valoración DCF de Ellomay Capital Ltd. (ELLO) |
Completamente Editable: Adáptelo A Sus Necesidades En Excel O Sheets
Diseño Profesional: Plantillas Confiables Y Estándares De La Industria
Predeterminadas Para Un Uso Rápido Y Eficiente
Compatible con MAC / PC, completamente desbloqueado
No Se Necesita Experiencia; Fáciles De Seguir
Ellomay Capital Ltd. (ELLO) Bundle
¡Optimice su tiempo y mejore la precisión con nuestra calculadora DCF (ello)! Utilizando datos reales de Ellomay Capital Ltd. y suposiciones personalizables, esta herramienta le permite pronosticar, analizar y evaluar (ELLO) como un inversor experimentado.
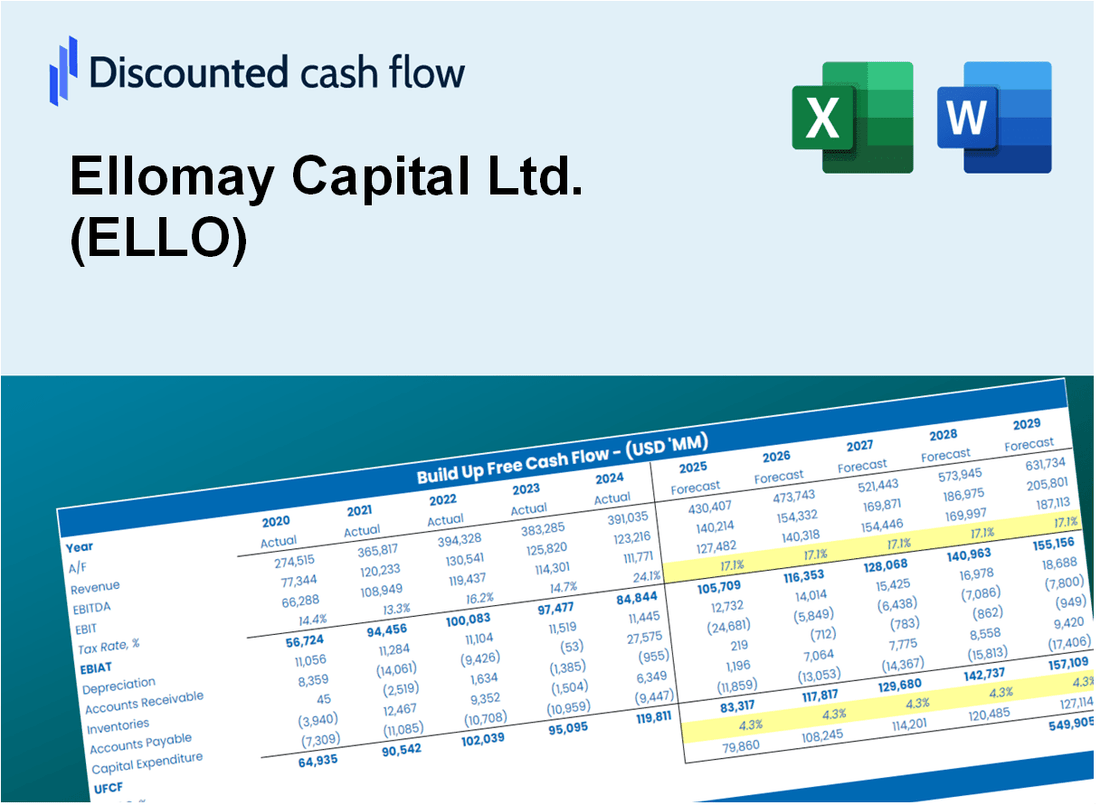
Discounted Cash Flow (DCF) - (USD MM)
| Year | AY1 2020 |
AY2 2021 |
AY3 2022 |
AY4 2023 |
AY5 2024 |
FY1 2025 |
FY2 2026 |
FY3 2027 |
FY4 2028 |
FY5 2029 |
|---|---|---|---|---|---|---|---|---|---|---|
| Revenue | 11.2 | 52.1 | 60.7 | 56.8 | 47.1 | 58.0 | 71.5 | 88.1 | 108.6 | 133.8 |
| Revenue Growth, % | 0 | 364.31 | 16.65 | -6.52 | -17.13 | 23.25 | 23.25 | 23.25 | 23.25 | 23.25 |
| EBITDA | 1.3 | 21.7 | 31.4 | 34.3 | 23.8 | 25.1 | 30.9 | 38.1 | 46.9 | 57.9 |
| EBITDA, % | 11.89 | 41.73 | 51.65 | 60.42 | 50.48 | 43.23 | 43.23 | 43.23 | 43.23 | 43.23 |
| Depreciation | 3.5 | 16.3 | 18.7 | 19.2 | 18.5 | 19.3 | 23.7 | 29.2 | 36.0 | 44.4 |
| Depreciation, % | 30.84 | 31.21 | 30.8 | 33.73 | 39.38 | 33.19 | 33.19 | 33.19 | 33.19 | 33.19 |
| EBIT | -2.1 | 5.5 | 12.7 | 15.2 | 5.2 | 5.8 | 7.2 | 8.8 | 10.9 | 13.4 |
| EBIT, % | -18.95 | 10.52 | 20.84 | 26.69 | 11.1 | 10.04 | 10.04 | 10.04 | 10.04 | 10.04 |
| Total Cash | 89.2 | 83.2 | 57.3 | 60.6 | 47.8 | 57.3 | 70.7 | 87.1 | 107.4 | 132.3 |
| Total Cash, percent | .0 | .0 | .0 | .0 | .0 | .0 | .0 | .0 | .0 | .0 |
| Account Receivables | 2.2 | 11.5 | 14.4 | .2 | 23.1 | 13.3 | 16.4 | 20.2 | 24.9 | 30.7 |
| Account Receivables, % | 19.42 | 22.14 | 23.78 | 0.41979 | 48.99 | 22.95 | 22.95 | 22.95 | 22.95 | 22.95 |
| Inventories | .4 | .7 | 1.4 | 1.4 | 1.1 | 1.3 | 1.7 | 2.0 | 2.5 | 3.1 |
| Inventories, % | 3.17 | 1.43 | 2.3 | 2.4 | 2.25 | 2.31 | 2.31 | 2.31 | 2.31 | 2.31 |
| Accounts Payable | 14.4 | 3.4 | 5.2 | 6.1 | 10.3 | 17.1 | 21.1 | 26.0 | 32.1 | 39.5 |
| Accounts Payable, % | 128.43 | 6.48 | 8.62 | 10.75 | 21.88 | 29.55 | 29.55 | 29.55 | 29.55 | 29.55 |
| Capital Expenditure | -149.3 | -96.3 | -56.5 | -71.1 | -87.7 | -57.2 | -70.5 | -86.9 | -107.1 | -132.0 |
| Capital Expenditure, % | -1331.47 | -184.91 | -93.05 | -125.18 | -186.42 | -98.61 | -98.61 | -98.61 | -98.61 | -98.61 |
| Tax Rate, % | 38.26 | 38.26 | 38.26 | 38.26 | 38.26 | 38.26 | 38.26 | 38.26 | 38.26 | 38.26 |
| EBITAT | -1.6 | 3.6 | -4.2 | 34.5 | 3.2 | 3.5 | 4.3 | 5.3 | 6.6 | 8.1 |
| Depreciation | ||||||||||
| Changes in Account Receivables | ||||||||||
| Changes in Inventories | ||||||||||
| Changes in Accounts Payable | ||||||||||
| Capital Expenditure | ||||||||||
| UFCF | -135.6 | -97.2 | -43.7 | -2.4 | -84.3 | -18.1 | -41.9 | -51.6 | -63.6 | -78.4 |
| WACC, % | 4.56 | 4.36 | 2.66 | 5.25 | 4.26 | 4.22 | 4.22 | 4.22 | 4.22 | 4.22 |
| PV UFCF | ||||||||||
| SUM PV UFCF | -219.2 | |||||||||
| Long Term Growth Rate, % | 2.00 | |||||||||
| Free cash flow (T + 1) | -80 | |||||||||
| Terminal Value | -3,604 | |||||||||
| Present Terminal Value | -2,932 | |||||||||
| Enterprise Value | -3,151 | |||||||||
| Net Debt | 558 | |||||||||
| Equity Value | -3,709 | |||||||||
| Diluted Shares Outstanding, MM | 13 | |||||||||
| Equity Value Per Share | -286.86 |
What You Will Receive
- Comprehensive Financial Model: Ellomay Capital Ltd.'s (ELLO) actual data facilitates accurate DCF valuation.
- Complete Forecast Customization: Modify revenue growth, profit margins, WACC, and other essential metrics.
- Real-Time Calculations: Automatic updates provide immediate feedback as you adjust inputs.
- Professional-Grade Template: An expertly crafted Excel file suitable for investor presentations.
- Flexible and Reusable: Designed for adaptability, enabling ongoing use for in-depth forecasts.
Key Features
- 🔍 Real-Life ELLO Financials: Pre-filled historical and projected data for Ellomay Capital Ltd. (ELLO).
- ✏️ Fully Customizable Inputs: Adjust all critical parameters (yellow cells) like WACC, growth %, and tax rates.
- 📊 Professional DCF Valuation: Built-in formulas calculate Ellomay’s intrinsic value using the Discounted Cash Flow method.
- ⚡ Instant Results: Visualize Ellomay’s valuation instantly after making changes.
- Scenario Analysis: Test and compare outcomes for various financial assumptions side-by-side.
How It Works
- Step 1: Download the Excel file.
- Step 2: Review pre-entered Ellomay Capital Ltd. (ELLO) data (historical and projected).
- Step 3: Adjust key assumptions (yellow cells) based on your analysis.
- Step 4: View automatic recalculations for Ellomay Capital Ltd. (ELLO)’s intrinsic value.
- Step 5: Use the outputs for investment decisions or reporting.
Why Choose Ellomay Capital Ltd. (ELLO) Calculator?
- Accurate Data: Utilize real financial metrics from Ellomay Capital for trustworthy valuation outcomes.
- Customizable: Tailor essential inputs like growth rates, WACC, and tax rates to fit your forecasts.
- Time-Saving: Pre-configured calculations streamline the process, eliminating the need to start from the ground up.
- Professional-Grade Tool: Crafted for investors, analysts, and financial consultants.
- User-Friendly: Clear layout and guided instructions ensure accessibility for all users.
Who Should Use Ellomay Capital Ltd. (ELLO)?
- Finance Students: Explore renewable energy investments and analyze financial metrics using real-world data.
- Academics: Integrate sustainable investment models into your research or teaching materials.
- Investors: Evaluate your investment strategies and assess the performance of Ellomay Capital Ltd. (ELLO).
- Analysts: Enhance your analysis with a tailored model for assessing renewable energy projects.
- Small Business Owners: Understand how publicly traded companies like Ellomay Capital Ltd. (ELLO) navigate the energy market.
What the Template Contains
- Preloaded ELLO Data: Historical and projected financial data, including revenue, EBIT, and capital expenditures.
- DCF and WACC Models: Professional-grade sheets for calculating intrinsic value and Weighted Average Cost of Capital.
- Editable Inputs: Yellow-highlighted cells for adjusting revenue growth, tax rates, and discount rates.
- Financial Statements: Comprehensive annual and quarterly financials for deeper analysis.
- Key Ratios: Profitability, leverage, and efficiency ratios to evaluate performance.
- Dashboard and Charts: Visual summaries of valuation outcomes and assumptions.
Disclaimer
All information, articles, and product details provided on this website are for general informational and educational purposes only. We do not claim any ownership over, nor do we intend to infringe upon, any trademarks, copyrights, logos, brand names, or other intellectual property mentioned or depicted on this site. Such intellectual property remains the property of its respective owners, and any references here are made solely for identification or informational purposes, without implying any affiliation, endorsement, or partnership.
We make no representations or warranties, express or implied, regarding the accuracy, completeness, or suitability of any content or products presented. Nothing on this website should be construed as legal, tax, investment, financial, medical, or other professional advice. In addition, no part of this site—including articles or product references—constitutes a solicitation, recommendation, endorsement, advertisement, or offer to buy or sell any securities, franchises, or other financial instruments, particularly in jurisdictions where such activity would be unlawful.
All content is of a general nature and may not address the specific circumstances of any individual or entity. It is not a substitute for professional advice or services. Any actions you take based on the information provided here are strictly at your own risk. You accept full responsibility for any decisions or outcomes arising from your use of this website and agree to release us from any liability in connection with your use of, or reliance upon, the content or products found herein.