
|
Valoración DCF de la Companhia Paranaense de Energia - COPEL (ELP) |
Completamente Editable: Adáptelo A Sus Necesidades En Excel O Sheets
Diseño Profesional: Plantillas Confiables Y Estándares De La Industria
Predeterminadas Para Un Uso Rápido Y Eficiente
Compatible con MAC / PC, completamente desbloqueado
No Se Necesita Experiencia; Fáciles De Seguir
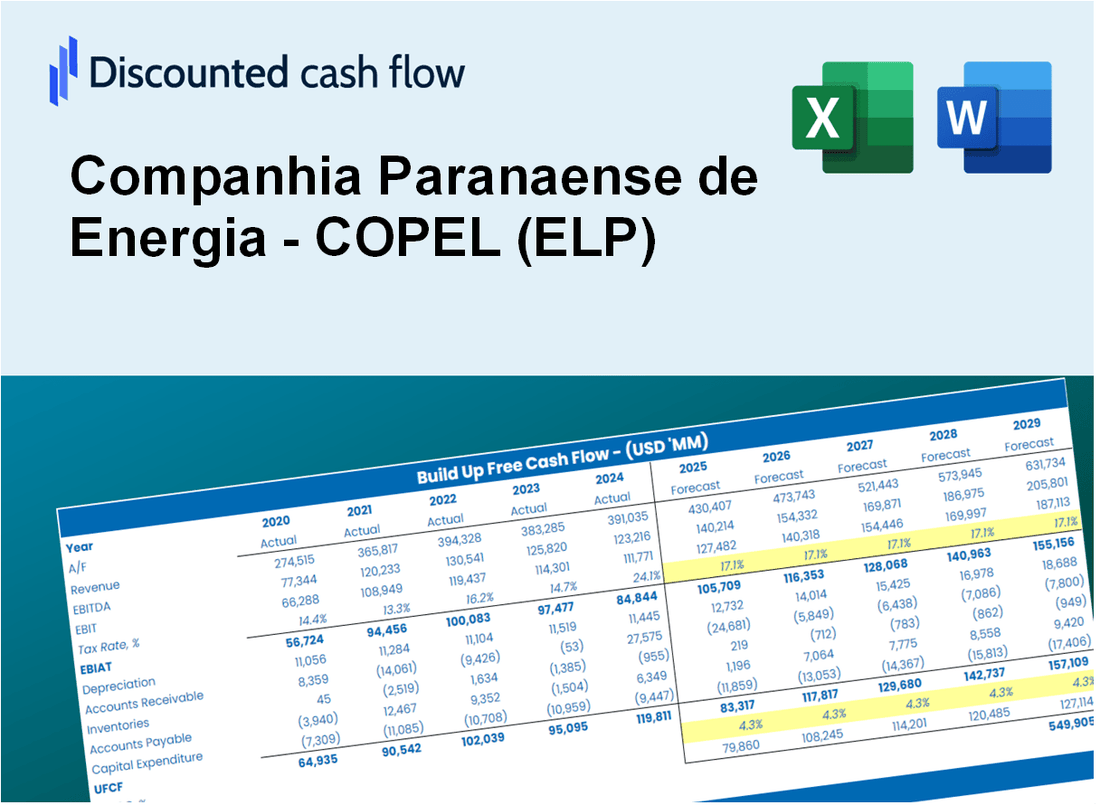
Companhia Paranaense de Energia - COPEL (ELP) Bundle
Diseñada para la precisión, nuestra calculadora DCF (ELP) le permite evaluar a la compañía paranaense de Energia: la valoración de Copel utilizando datos financieros del mundo real, que ofrece una flexibilidad completa para modificar todos los parámetros esenciales para mejorar las proyecciones.
Discounted Cash Flow (DCF) - (USD MM)
| Year | AY1 2020 |
AY2 2021 |
AY3 2022 |
AY4 2023 |
AY5 2024 |
FY1 2025 |
FY2 2026 |
FY3 2027 |
FY4 2028 |
FY5 2029 |
|---|---|---|---|---|---|---|---|---|---|---|
| Revenue | 3,506.4 | 4,513.3 | 3,864.3 | 4,042.0 | 4,262.4 | 4,522.3 | 4,798.1 | 5,090.6 | 5,401.0 | 5,730.4 |
| Revenue Growth, % | 0 | 28.72 | -14.38 | 4.6 | 5.45 | 6.1 | 6.1 | 6.1 | 6.1 | 6.1 |
| EBITDA | 1,244.5 | 1,061.3 | 684.7 | 745.5 | 973.0 | 1,067.2 | 1,132.3 | 1,201.3 | 1,274.6 | 1,352.3 |
| EBITDA, % | 35.49 | 23.51 | 17.72 | 18.44 | 22.83 | 23.6 | 23.6 | 23.6 | 23.6 | 23.6 |
| Depreciation | 190.0 | 191.4 | 219.9 | 260.1 | 261.1 | 252.4 | 267.8 | 284.2 | 301.5 | 319.9 |
| Depreciation, % | 5.42 | 4.24 | 5.69 | 6.43 | 6.13 | 5.58 | 5.58 | 5.58 | 5.58 | 5.58 |
| EBIT | 1,054.4 | 869.8 | 464.8 | 485.4 | 711.9 | 814.8 | 864.5 | 917.2 | 973.1 | 1,032.4 |
| EBIT, % | 30.07 | 19.27 | 12.03 | 12.01 | 16.7 | 18.02 | 18.02 | 18.02 | 18.02 | 18.02 |
| Total Cash | 606.7 | 728.8 | 504.0 | 1,064.1 | 783.3 | 824.9 | 875.1 | 928.5 | 985.1 | 1,045.2 |
| Total Cash, percent | .0 | .0 | .0 | .0 | .0 | .0 | .0 | .0 | .0 | .0 |
| Account Receivables | 762.9 | 1,329.6 | 670.4 | 1,125.5 | 799.1 | 1,041.6 | 1,105.1 | 1,172.5 | 1,243.9 | 1,319.8 |
| Account Receivables, % | 21.76 | 29.46 | 17.35 | 27.85 | 18.75 | 23.03 | 23.03 | 23.03 | 23.03 | 23.03 |
| Inventories | 30.6 | 37.2 | 36.7 | 32.9 | 25.7 | 36.7 | 39.0 | 41.4 | 43.9 | 46.6 |
| Inventories, % | 0.87366 | 0.82462 | 0.94885 | 0.81346 | 0.60184 | 0.81249 | 0.81249 | 0.81249 | 0.81249 | 0.81249 |
| Accounts Payable | 431.2 | 506.3 | 393.3 | 424.6 | 437.4 | 492.6 | 522.6 | 554.5 | 588.3 | 624.2 |
| Accounts Payable, % | 12.3 | 11.22 | 10.18 | 10.5 | 10.26 | 10.89 | 10.89 | 10.89 | 10.89 | 10.89 |
| Capital Expenditure | -47.0 | -64.5 | -73.4 | -41.1 | -25.9 | -56.9 | -60.4 | -64.1 | -68.0 | -72.1 |
| Capital Expenditure, % | -1.34 | -1.43 | -1.9 | -1.02 | -0.60763 | -1.26 | -1.26 | -1.26 | -1.26 | -1.26 |
| Tax Rate, % | 3.36 | 3.36 | 3.36 | 3.36 | 3.36 | 3.36 | 3.36 | 3.36 | 3.36 | 3.36 |
| EBITAT | 804.1 | 841.6 | 548.2 | 440.4 | 688.0 | 750.2 | 796.0 | 844.5 | 896.0 | 950.6 |
| Depreciation | ||||||||||
| Changes in Account Receivables | ||||||||||
| Changes in Inventories | ||||||||||
| Changes in Accounts Payable | ||||||||||
| Capital Expenditure | ||||||||||
| UFCF | 584.9 | 470.4 | 1,241.3 | 239.4 | 1,269.6 | 747.4 | 967.7 | 1,026.7 | 1,089.3 | 1,155.7 |
| WACC, % | 3.87 | 4.35 | 4.42 | 4.21 | 4.35 | 4.24 | 4.24 | 4.24 | 4.24 | 4.24 |
| PV UFCF | ||||||||||
| SUM PV UFCF | 4,375.6 | |||||||||
| Long Term Growth Rate, % | 2.00 | |||||||||
| Free cash flow (T + 1) | 1,179 | |||||||||
| Terminal Value | 52,610 | |||||||||
| Present Terminal Value | 42,745 | |||||||||
| Enterprise Value | 47,120 | |||||||||
| Net Debt | 2,524 | |||||||||
| Equity Value | 44,596 | |||||||||
| Diluted Shares Outstanding, MM | 187 | |||||||||
| Equity Value Per Share | 239.07 |
What You Will Get
- Editable Forecast Inputs: Easily modify assumptions (growth %, margins, WACC) to explore various scenarios.
- Real-World Data: COPEL’s financial information pre-filled to accelerate your analysis.
- Automatic DCF Outputs: The template calculates Net Present Value (NPV) and intrinsic value for you.
- Customizable and Professional: A refined Excel model that adapts to your valuation requirements.
- Built for Analysts and Investors: Perfect for evaluating projections, validating strategies, and enhancing efficiency.
Key Features
- Comprehensive DCF Calculator: Offers detailed unlevered and levered DCF valuation models tailored for COPEL (ELP).
- WACC Calculator: Features a pre-built Weighted Average Cost of Capital sheet with adjustable inputs specific to COPEL (ELP).
- Customizable Forecast Assumptions: Adjust growth rates, capital expenditures, and discount rates to fit COPEL (ELP) projections.
- Integrated Financial Ratios: Evaluate profitability, leverage, and efficiency ratios pertinent to COPEL (ELP).
- Interactive Dashboard and Charts: Visual representations summarize essential valuation metrics for straightforward analysis of COPEL (ELP).
How It Works
- Download the Template: Gain immediate access to the Excel-based COPEL (ELP) DCF Calculator.
- Input Your Assumptions: Modify the yellow-highlighted cells for growth rates, WACC, margins, and additional parameters.
- Instant Calculations: The model automatically recalculates COPEL’s intrinsic value.
- Test Scenarios: Experiment with various assumptions to assess potential valuation shifts.
- Analyze and Decide: Utilize the outcomes to inform your investment or financial analysis.
Why Choose This Calculator for Companhia Paranaense de Energia - COPEL (ELP)?
- All-in-One Solution: Combines DCF, WACC, and financial ratio analyses tailored for COPEL (ELP).
- Flexible Inputs: Modify the highlighted cells to explore different financial scenarios.
- In-Depth Analysis: Automatically computes COPEL’s intrinsic value and Net Present Value.
- Preloaded Information: Access historical and projected data for a solid foundation.
- High-Quality Standards: Perfect for financial analysts, investors, and business advisors focusing on COPEL (ELP).
Who Should Use This Product?
- Professional Investors: Develop comprehensive and accurate valuation models for analyzing COPEL (ELP) investments.
- Corporate Finance Teams: Evaluate valuation scenarios to inform strategic decisions within the organization.
- Consultants and Advisors: Deliver precise valuation insights to clients regarding COPEL (ELP) stock.
- Students and Educators: Utilize real-world data to enhance learning and practice in financial modeling.
- Energy Sector Enthusiasts: Gain insights into how energy companies like COPEL (ELP) are valued in the marketplace.
What the Template Contains
- Historical Data: Includes COPEL’s past financials and baseline forecasts.
- DCF and Levered DCF Models: Detailed templates to calculate COPEL’s intrinsic value.
- WACC Sheet: Pre-built calculations for Weighted Average Cost of Capital.
- Editable Inputs: Modify key drivers like growth rates, EBITDA %, and CAPEX assumptions.
- Quarterly and Annual Statements: A complete breakdown of COPEL’s financials.
- Interactive Dashboard: Visualize valuation results and projections dynamically.
Disclaimer
All information, articles, and product details provided on this website are for general informational and educational purposes only. We do not claim any ownership over, nor do we intend to infringe upon, any trademarks, copyrights, logos, brand names, or other intellectual property mentioned or depicted on this site. Such intellectual property remains the property of its respective owners, and any references here are made solely for identification or informational purposes, without implying any affiliation, endorsement, or partnership.
We make no representations or warranties, express or implied, regarding the accuracy, completeness, or suitability of any content or products presented. Nothing on this website should be construed as legal, tax, investment, financial, medical, or other professional advice. In addition, no part of this site—including articles or product references—constitutes a solicitation, recommendation, endorsement, advertisement, or offer to buy or sell any securities, franchises, or other financial instruments, particularly in jurisdictions where such activity would be unlawful.
All content is of a general nature and may not address the specific circumstances of any individual or entity. It is not a substitute for professional advice or services. Any actions you take based on the information provided here are strictly at your own risk. You accept full responsibility for any decisions or outcomes arising from your use of this website and agree to release us from any liability in connection with your use of, or reliance upon, the content or products found herein.