
|
Valoración DCF de Eastman Chemical Company (EMN) |
Completamente Editable: Adáptelo A Sus Necesidades En Excel O Sheets
Diseño Profesional: Plantillas Confiables Y Estándares De La Industria
Predeterminadas Para Un Uso Rápido Y Eficiente
Compatible con MAC / PC, completamente desbloqueado
No Se Necesita Experiencia; Fáciles De Seguir
Eastman Chemical Company (EMN) Bundle
¡Agilice su análisis y mejore la precisión con nuestra calculadora DCF (EMN)! Utilizando datos reales de Eastman Chemical Company y suposiciones personalizables, esta herramienta le permite pronosticar, evaluar y evaluar (EMN) como un inversor experimentado.
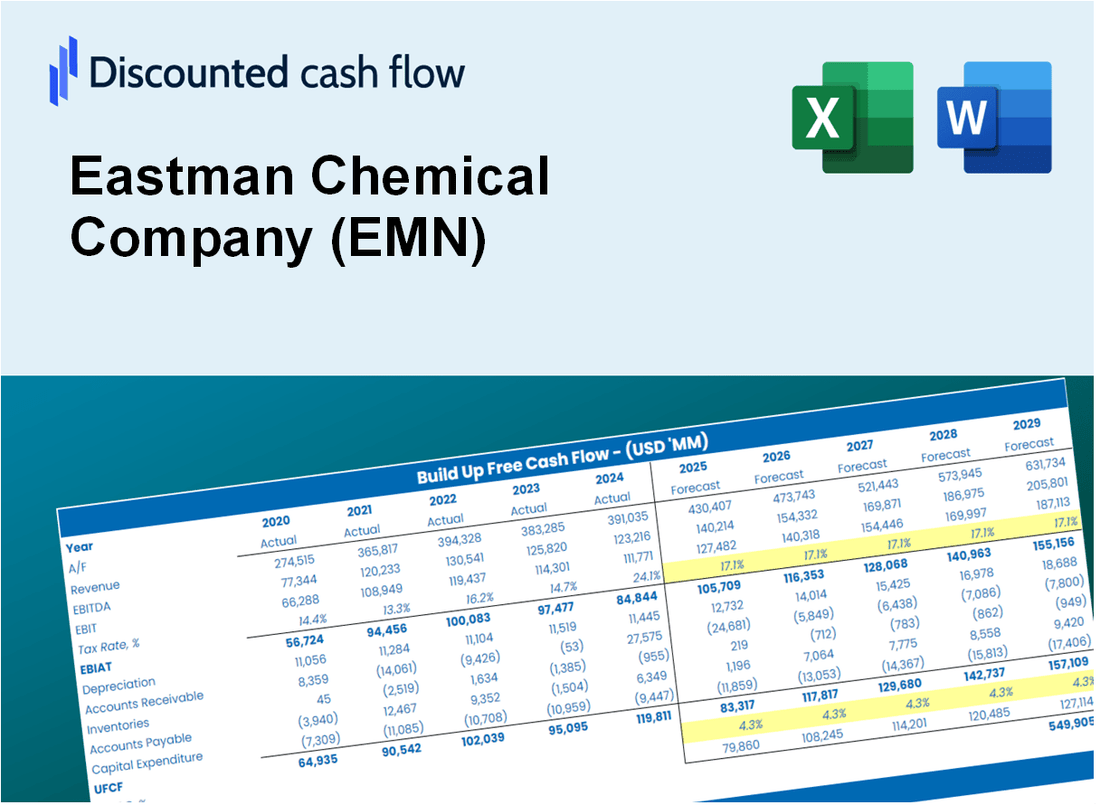
Discounted Cash Flow (DCF) - (USD MM)
| Year | AY1 2020 |
AY2 2021 |
AY3 2022 |
AY4 2023 |
AY5 2024 |
FY1 2025 |
FY2 2026 |
FY3 2027 |
FY4 2028 |
FY5 2029 |
|---|---|---|---|---|---|---|---|---|---|---|
| Revenue | 8,464.0 | 10,483.0 | 10,535.0 | 9,198.0 | 9,374.0 | 9,692.1 | 10,020.9 | 10,361.0 | 10,712.5 | 11,076.0 |
| Revenue Growth, % | 0 | 23.85 | 0.49604 | -12.69 | 1.91 | 3.39 | 3.39 | 3.39 | 3.39 | 3.39 |
| EBITDA | 1,309.0 | 1,812.0 | 1,636.0 | 1,807.0 | 1,800.0 | 1,688.9 | 1,746.2 | 1,805.4 | 1,866.7 | 1,930.0 |
| EBITDA, % | 15.47 | 17.29 | 15.53 | 19.65 | 19.2 | 17.43 | 17.43 | 17.43 | 17.43 | 17.43 |
| Depreciation | 574.0 | 538.0 | 477.0 | 498.0 | 509.0 | 528.9 | 546.9 | 565.4 | 584.6 | 604.4 |
| Depreciation, % | 6.78 | 5.13 | 4.53 | 5.41 | 5.43 | 5.46 | 5.46 | 5.46 | 5.46 | 5.46 |
| EBIT | 735.0 | 1,274.0 | 1,159.0 | 1,309.0 | 1,291.0 | 1,160.0 | 1,199.3 | 1,240.0 | 1,282.1 | 1,325.6 |
| EBIT, % | 8.68 | 12.15 | 11 | 14.23 | 13.77 | 11.97 | 11.97 | 11.97 | 11.97 | 11.97 |
| Total Cash | 564.0 | 459.0 | 493.0 | 548.0 | 837.0 | 593.3 | 613.5 | 634.3 | 655.8 | 678.0 |
| Total Cash, percent | .0 | .0 | .0 | .0 | .0 | .0 | .0 | .0 | .0 | .0 |
| Account Receivables | 1,033.0 | 1,580.0 | 1,277.0 | 1,154.0 | 1,172.0 | 1,249.3 | 1,291.6 | 1,335.5 | 1,380.8 | 1,427.6 |
| Account Receivables, % | 12.2 | 15.07 | 12.12 | 12.55 | 12.5 | 12.89 | 12.89 | 12.89 | 12.89 | 12.89 |
| Inventories | 1,379.0 | 1,504.0 | 1,894.0 | 1,683.0 | 1,988.0 | 1,708.2 | 1,766.1 | 1,826.1 | 1,888.0 | 1,952.1 |
| Inventories, % | 16.29 | 14.35 | 17.98 | 18.3 | 21.21 | 17.62 | 17.62 | 17.62 | 17.62 | 17.62 |
| Accounts Payable | 799.0 | 1,228.0 | 1,319.0 | 1,170.0 | 1,309.0 | 1,170.0 | 1,209.7 | 1,250.7 | 1,293.2 | 1,337.1 |
| Accounts Payable, % | 9.44 | 11.71 | 12.52 | 12.72 | 13.96 | 12.07 | 12.07 | 12.07 | 12.07 | 12.07 |
| Capital Expenditure | -396.0 | -578.0 | -611.0 | -828.0 | -599.0 | -608.4 | -629.0 | -650.3 | -672.4 | -695.2 |
| Capital Expenditure, % | -4.68 | -5.51 | -5.8 | -9 | -6.39 | -6.28 | -6.28 | -6.28 | -6.28 | -6.28 |
| Tax Rate, % | 16.05 | 16.05 | 16.05 | 16.05 | 16.05 | 16.05 | 16.05 | 16.05 | 16.05 | 16.05 |
| EBITAT | 662.9 | 1,009.1 | 940.7 | 1,076.6 | 1,083.8 | 966.9 | 999.7 | 1,033.6 | 1,068.7 | 1,104.9 |
| Depreciation | ||||||||||
| Changes in Account Receivables | ||||||||||
| Changes in Inventories | ||||||||||
| Changes in Accounts Payable | ||||||||||
| Capital Expenditure | ||||||||||
| UFCF | -772.1 | 726.1 | 810.7 | 931.6 | 809.8 | 951.0 | 856.9 | 886.0 | 916.0 | 947.1 |
| WACC, % | 7.35 | 7.16 | 7.19 | 7.21 | 7.24 | 7.23 | 7.23 | 7.23 | 7.23 | 7.23 |
| PV UFCF | ||||||||||
| SUM PV UFCF | 3,711.4 | |||||||||
| Long Term Growth Rate, % | 3.00 | |||||||||
| Free cash flow (T + 1) | 976 | |||||||||
| Terminal Value | 23,052 | |||||||||
| Present Terminal Value | 16,259 | |||||||||
| Enterprise Value | 19,970 | |||||||||
| Net Debt | 4,180 | |||||||||
| Equity Value | 15,790 | |||||||||
| Diluted Shares Outstanding, MM | 118 | |||||||||
| Equity Value Per Share | 133.93 |
What You Will Get
- Editable Forecast Inputs: Easily modify assumptions (growth %, margins, WACC) to explore various scenarios.
- Real-World Data: Eastman Chemical Company's (EMN) financial data pre-filled to kickstart your analysis.
- Automatic DCF Outputs: The template computes Net Present Value (NPV) and intrinsic value for you.
- Customizable and Professional: A refined Excel model that adjusts to your valuation requirements.
- Built for Analysts and Investors: Perfect for assessing projections, validating strategies, and enhancing efficiency.
Key Features
- Pre-Loaded Data: Eastman Chemical Company's historical financial statements and pre-filled forecasts.
- Fully Adjustable Inputs: Modify WACC, tax rates, revenue growth, and EBITDA margins as needed.
- Instant Results: Watch Eastman Chemical's intrinsic value recalculate in real time.
- Clear Visual Outputs: Dashboard charts present valuation results and essential metrics.
- Built for Accuracy: A professional tool designed for analysts, investors, and finance professionals.
How It Works
- Download: Get the pre-formatted Excel file featuring Eastman Chemical Company's (EMN) financial data.
- Customize: Modify projections, including revenue growth, EBITDA %, and WACC as needed.
- Update Automatically: Watch the intrinsic value and NPV calculations refresh in real-time.
- Test Scenarios: Generate various forecasts and instantly evaluate different outcomes.
- Make Decisions: Leverage the valuation insights to inform your investment choices.
Why Choose This Calculator for Eastman Chemical Company (EMN)?
- User-Friendly Interface: Tailored for both novices and seasoned professionals.
- Customizable Inputs: Adjust parameters effortlessly to suit your specific analysis.
- Real-Time Valuation: Observe immediate updates to Eastman Chemical's valuation as you tweak inputs.
- Preloaded Data: Comes equipped with Eastman Chemical’s latest financial information for swift evaluations.
- Preferred by Experts: Employed by investors and analysts for making well-informed choices.
Who Should Use This Product?
- Finance Students: Explore valuation methodologies and apply them to real-world data for Eastman Chemical Company (EMN).
- Academics: Utilize industry-standard models in your teaching or research involving Eastman Chemical Company (EMN).
- Investors: Evaluate your investment hypotheses and assess valuation scenarios for Eastman Chemical Company (EMN).
- Analysts: Enhance your analysis process with a ready-to-use, customizable DCF model tailored for Eastman Chemical Company (EMN).
- Small Business Owners: Understand the analytical approaches used for large corporations like Eastman Chemical Company (EMN).
What the Template Contains
- Pre-Filled Data: Includes Eastman Chemical Company’s historical financials and forecasts.
- Discounted Cash Flow Model: Editable DCF valuation model with automatic calculations.
- Weighted Average Cost of Capital (WACC): A dedicated sheet for calculating WACC based on custom inputs.
- Key Financial Ratios: Analyze Eastman Chemical Company’s profitability, efficiency, and leverage.
- Customizable Inputs: Edit revenue growth, margins, and tax rates with ease.
- Clear Dashboard: Charts and tables summarizing key valuation results.
Disclaimer
All information, articles, and product details provided on this website are for general informational and educational purposes only. We do not claim any ownership over, nor do we intend to infringe upon, any trademarks, copyrights, logos, brand names, or other intellectual property mentioned or depicted on this site. Such intellectual property remains the property of its respective owners, and any references here are made solely for identification or informational purposes, without implying any affiliation, endorsement, or partnership.
We make no representations or warranties, express or implied, regarding the accuracy, completeness, or suitability of any content or products presented. Nothing on this website should be construed as legal, tax, investment, financial, medical, or other professional advice. In addition, no part of this site—including articles or product references—constitutes a solicitation, recommendation, endorsement, advertisement, or offer to buy or sell any securities, franchises, or other financial instruments, particularly in jurisdictions where such activity would be unlawful.
All content is of a general nature and may not address the specific circumstances of any individual or entity. It is not a substitute for professional advice or services. Any actions you take based on the information provided here are strictly at your own risk. You accept full responsibility for any decisions or outcomes arising from your use of this website and agree to release us from any liability in connection with your use of, or reliance upon, the content or products found herein.