
|
Valoración de DCF de Emudhra Limited (Emudhra.NS) |
Completamente Editable: Adáptelo A Sus Necesidades En Excel O Sheets
Diseño Profesional: Plantillas Confiables Y Estándares De La Industria
Predeterminadas Para Un Uso Rápido Y Eficiente
Compatible con MAC / PC, completamente desbloqueado
No Se Necesita Experiencia; Fáciles De Seguir
eMudhra Limited (EMUDHRA.NS) Bundle
¡Mejore sus opciones de inversión con la calculadora DCF de Emudhra Limited (Emudhrans)! Explore datos financieros auténticos para Emudhra, ajuste las proyecciones y gastos de crecimiento, y observe instantáneamente cómo estas modificaciones afectan el valor intrínseco de Emudhra Limited (emudhrans).
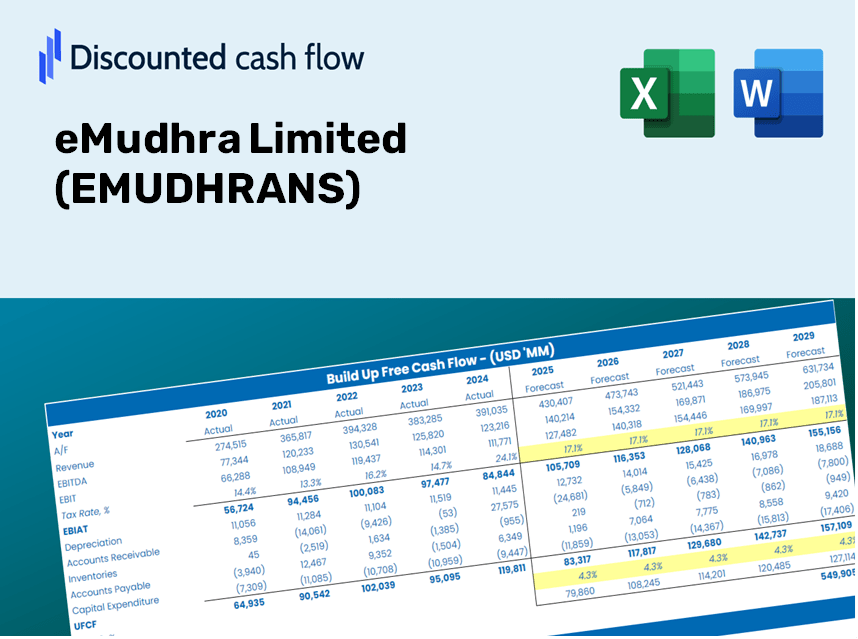
Discounted Cash Flow (DCF) - (USD MM)
| Year | AY1 2021 |
AY2 2022 |
AY3 2023 |
AY4 2024 |
AY5 2025 |
FY1 2026 |
FY2 2027 |
FY3 2028 |
FY4 2029 |
FY5 2030 |
|---|---|---|---|---|---|---|---|---|---|---|
| Revenue | 1,315.9 | 1,826.4 | 2,487.6 | 3,731.2 | 5,193.9 | 7,325.8 | 10,332.7 | 14,574.0 | 20,556.1 | 28,993.7 |
| Revenue Growth, % | 0 | 38.79 | 36.2 | 49.99 | 39.2 | 41.05 | 41.05 | 41.05 | 41.05 | 41.05 |
| EBITDA | 407.8 | 680.9 | 925.6 | 1,164.7 | 1,239.3 | 2,352.4 | 3,317.9 | 4,679.9 | 6,600.8 | 9,310.2 |
| EBITDA, % | 30.99 | 37.28 | 37.21 | 31.22 | 23.86 | 32.11 | 32.11 | 32.11 | 32.11 | 32.11 |
| Depreciation | 87.7 | 130.7 | 158.5 | 208.1 | 238.3 | 444.7 | 627.2 | 884.7 | 1,247.9 | 1,760.1 |
| Depreciation, % | 6.66 | 7.16 | 6.37 | 5.58 | 4.59 | 6.07 | 6.07 | 6.07 | 6.07 | 6.07 |
| EBIT | 320.1 | 550.2 | 767.1 | 956.7 | 1,001.1 | 1,907.7 | 2,690.7 | 3,795.1 | 5,352.9 | 7,550.1 |
| EBIT, % | 24.33 | 30.12 | 30.84 | 25.64 | 19.27 | 26.04 | 26.04 | 26.04 | 26.04 | 26.04 |
| Total Cash | 77.8 | 82.6 | 1,188.0 | 2,492.9 | 1,868.2 | 2,358.4 | 3,326.4 | 4,691.8 | 6,617.6 | 9,333.9 |
| Total Cash, percent | .0 | .0 | .0 | .0 | .0 | .0 | .0 | .0 | .0 | .0 |
| Account Receivables | 286.4 | 704.6 | 1,234.9 | 1,785.4 | 2,242.8 | 2,945.1 | 4,154.0 | 5,859.1 | 8,264.0 | 11,656.1 |
| Account Receivables, % | 21.76 | 38.58 | 49.64 | 47.85 | 43.18 | 40.2 | 40.2 | 40.2 | 40.2 | 40.2 |
| Inventories | 7.1 | 21.4 | 10.3 | 29.4 | 14.0 | 46.7 | 65.8 | 92.8 | 130.9 | 184.7 |
| Inventories, % | 0.54258 | 1.17 | 0.41567 | 0.78688 | 0.26936 | 0.63702 | 0.63702 | 0.63702 | 0.63702 | 0.63702 |
| Accounts Payable | 35.0 | 143.7 | 182.1 | 239.6 | 314.3 | 444.3 | 626.7 | 883.9 | 1,246.7 | 1,758.4 |
| Accounts Payable, % | 2.66 | 7.87 | 7.32 | 6.42 | 6.05 | 6.06 | 6.06 | 6.06 | 6.06 | 6.06 |
| Capital Expenditure | -347.7 | -467.1 | -620.7 | -738.5 | -832.0 | -1,652.1 | -2,330.3 | -3,286.8 | -4,635.9 | -6,538.8 |
| Capital Expenditure, % | -26.42 | -25.58 | -24.95 | -19.79 | -16.02 | -22.55 | -22.55 | -22.55 | -22.55 | -22.55 |
| Tax Rate, % | 21.19 | 21.19 | 21.19 | 21.19 | 21.19 | 21.19 | 21.19 | 21.19 | 21.19 | 21.19 |
| EBITAT | 179.3 | 451.5 | 644.8 | 775.0 | 788.9 | 1,457.2 | 2,055.3 | 2,898.9 | 4,088.8 | 5,767.1 |
| Depreciation | ||||||||||
| Changes in Account Receivables | ||||||||||
| Changes in Inventories | ||||||||||
| Changes in Accounts Payable | ||||||||||
| Capital Expenditure | ||||||||||
| UFCF | -339.3 | -208.7 | -298.3 | -267.5 | -172.2 | -355.3 | -693.4 | -978.0 | -1,379.5 | -1,945.7 |
| WACC, % | 4.66 | 4.66 | 4.66 | 4.66 | 4.66 | 4.66 | 4.66 | 4.66 | 4.66 | 4.66 |
| PV UFCF | ||||||||||
| SUM PV UFCF | -4,524.2 | |||||||||
| Long Term Growth Rate, % | 4.00 | |||||||||
| Free cash flow (T + 1) | -2,024 | |||||||||
| Terminal Value | -304,753 | |||||||||
| Present Terminal Value | -242,639 | |||||||||
| Enterprise Value | -247,163 | |||||||||
| Net Debt | -1,073 | |||||||||
| Equity Value | -246,090 | |||||||||
| Diluted Shares Outstanding, MM | 83 | |||||||||
| Equity Value Per Share | -2,971.53 |
What You Will Receive
- Customizable Excel Template: A versatile Excel-based DCF Calculator featuring pre-filled financial data for eMudhra Limited (EMUDHRANS).
- Authentic Financial Data: Access to historical figures and future projections (highlighted in the yellow cells).
- Flexible Forecasting: Adjust your assumptions regarding revenue growth, EBITDA %, and WACC as needed.
- Instant Calculations: Quickly observe how your input changes affect eMudhra’s valuation.
- Professional Resource: Designed for investors, CFOs, consultants, and financial analysts.
- Intuitive Interface: Organized for simplicity and ease of navigation, complete with step-by-step guidance.
Key Features
- 🔍 Real-Life EMUDHRANS Financials: Access pre-filled historical and projected data for eMudhra Limited.
- ✏️ Fully Customizable Inputs: Modify all essential parameters (yellow cells) such as WACC, growth %, and tax rates.
- 📊 Professional DCF Valuation: Integrated formulas calculate the intrinsic value of eMudhra Limited using the Discounted Cash Flow method.
- ⚡ Instant Results: View eMudhra's valuation instantly after any adjustments.
- Scenario Analysis: Evaluate and compare outcomes based on different financial assumptions side-by-side.
How It Works
- Step 1: Download the Excel file.
- Step 2: Review the pre-populated data for eMudhra Limited (EMUDHRANS), including both historical and projected information.
- Step 3: Modify the key assumptions (highlighted in yellow) to reflect your analysis.
- Step 4: Observe the automatic updates for eMudhra Limited's (EMUDHRANS) intrinsic value.
- Step 5: Utilize the results for your investment strategies or financial reporting.
Why Opt for This Calculator?
- All-in-One Solution: Combines DCF, WACC, and financial ratio evaluations in a single platform.
- Personalized Inputs: Modify the highlighted yellow cells to explore different scenarios.
- In-Depth Analysis: Automatically computes the intrinsic value and Net Present Value for eMudhra Limited (EMUDHRANS).
- Data Ready to Go: Features historical and projected data to provide a solid foundation for analysis.
- Professional-Grade Tool: Perfect for financial analysts, investors, and business consultants alike.
Who Can Benefit from This Product?
- Investors: Assess eMudhra Limited's (EMUDHRANS) valuation before making investment decisions.
- CFOs and Financial Analysts: Simplify valuation workflows and evaluate financial forecasts.
- Startup Founders: Discover the valuation methods used for established companies like eMudhra Limited.
- Consultants: Create expert valuation reports for clients based on eMudhra Limited's metrics.
- Students and Educators: Utilize real-time data to learn and teach valuation strategies.
Contents of the Template
- Detailed DCF Model: A fully editable template featuring extensive valuation calculations.
- Current Financial Data: Preloaded historical and projected financials for eMudhra Limited (EMUDHRANS) to facilitate analysis.
- Adjustable Parameters: Modify WACC, growth rates, and tax assumptions to explore various scenarios.
- Comprehensive Financial Statements: Annual and quarterly breakdowns for enhanced insights.
- Essential Ratios: Integrated analysis of profitability, efficiency, and leverage metrics.
- Interactive Dashboard with Visual Outputs: Charts and tables designed for clear, actionable results.
Disclaimer
All information, articles, and product details provided on this website are for general informational and educational purposes only. We do not claim any ownership over, nor do we intend to infringe upon, any trademarks, copyrights, logos, brand names, or other intellectual property mentioned or depicted on this site. Such intellectual property remains the property of its respective owners, and any references here are made solely for identification or informational purposes, without implying any affiliation, endorsement, or partnership.
We make no representations or warranties, express or implied, regarding the accuracy, completeness, or suitability of any content or products presented. Nothing on this website should be construed as legal, tax, investment, financial, medical, or other professional advice. In addition, no part of this site—including articles or product references—constitutes a solicitation, recommendation, endorsement, advertisement, or offer to buy or sell any securities, franchises, or other financial instruments, particularly in jurisdictions where such activity would be unlawful.
All content is of a general nature and may not address the specific circumstances of any individual or entity. It is not a substitute for professional advice or services. Any actions you take based on the information provided here are strictly at your own risk. You accept full responsibility for any decisions or outcomes arising from your use of this website and agree to release us from any liability in connection with your use of, or reliance upon, the content or products found herein.