
|
ESAB India Limited (Esabindia.NS) Valoración de DCF |
Completamente Editable: Adáptelo A Sus Necesidades En Excel O Sheets
Diseño Profesional: Plantillas Confiables Y Estándares De La Industria
Predeterminadas Para Un Uso Rápido Y Eficiente
Compatible con MAC / PC, completamente desbloqueado
No Se Necesita Experiencia; Fáciles De Seguir
ESAB India Limited (ESABINDIA.NS) Bundle
¡Mejore sus opciones de inversión con la calculadora DCF de ESAB India Limited (Esabindians)! Examine los datos financieros genuinos para ESAB, ajuste las proyecciones y gastos de crecimiento, y observe cómo estas modificaciones afectan el valor intrínseco de ESAB al instante.
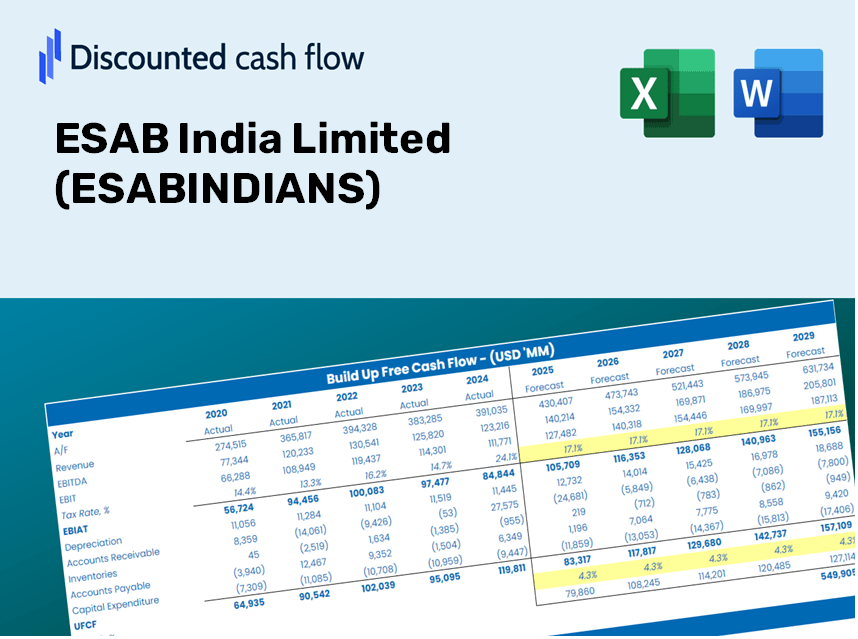
Discounted Cash Flow (DCF) - (USD MM)
| Year | AY1 2021 |
AY2 2022 |
AY3 2023 |
AY4 2024 |
AY5 2025 |
FY1 2026 |
FY2 2027 |
FY3 2028 |
FY4 2029 |
FY5 2030 |
|---|---|---|---|---|---|---|---|---|---|---|
| Revenue | 6,784.2 | 8,963.0 | 10,908.0 | 12,387.8 | 13,734.7 | 16,421.7 | 19,634.4 | 23,475.7 | 28,068.4 | 33,559.6 |
| Revenue Growth, % | 0 | 32.12 | 21.7 | 13.57 | 10.87 | 19.56 | 19.56 | 19.56 | 19.56 | 19.56 |
| EBITDA | 939.9 | 1,255.0 | 1,946.7 | 2,342.5 | 2,523.2 | 2,725.5 | 3,258.7 | 3,896.2 | 4,658.4 | 5,569.8 |
| EBITDA, % | 13.85 | 14 | 17.85 | 18.91 | 18.37 | 16.6 | 16.6 | 16.6 | 16.6 | 16.6 |
| Depreciation | 117.1 | 113.3 | 118.8 | 137.9 | 149.2 | 206.2 | 246.6 | 294.8 | 352.5 | 421.4 |
| Depreciation, % | 1.73 | 1.26 | 1.09 | 1.11 | 1.09 | 1.26 | 1.26 | 1.26 | 1.26 | 1.26 |
| EBIT | 822.8 | 1,141.7 | 1,827.9 | 2,204.6 | 2,374.0 | 2,519.2 | 3,012.1 | 3,601.4 | 4,306.0 | 5,148.4 |
| EBIT, % | 12.13 | 12.74 | 16.76 | 17.8 | 17.28 | 15.34 | 15.34 | 15.34 | 15.34 | 15.34 |
| Total Cash | 598.1 | 671.7 | 499.5 | 473.4 | 1,019.3 | 1,055.3 | 1,261.8 | 1,508.7 | 1,803.8 | 2,156.7 |
| Total Cash, percent | .0 | .0 | .0 | .0 | .0 | .0 | .0 | .0 | .0 | .0 |
| Account Receivables | 1,189.9 | 1,376.0 | 1,522.8 | 1,888.2 | 2,251.3 | 2,577.7 | 3,082.0 | 3,685.0 | 4,405.9 | 5,267.9 |
| Account Receivables, % | 17.54 | 15.35 | 13.96 | 15.24 | 16.39 | 15.7 | 15.7 | 15.7 | 15.7 | 15.7 |
| Inventories | 734.9 | 1,049.0 | 1,234.3 | 1,112.6 | 1,306.6 | 1,719.2 | 2,055.6 | 2,457.7 | 2,938.6 | 3,513.4 |
| Inventories, % | 10.83 | 11.7 | 11.32 | 8.98 | 9.51 | 10.47 | 10.47 | 10.47 | 10.47 | 10.47 |
| Accounts Payable | 963.9 | 1,437.7 | 1,518.2 | 1,334.3 | 1,945.8 | 2,269.6 | 2,713.7 | 3,244.6 | 3,879.3 | 4,638.3 |
| Accounts Payable, % | 14.21 | 16.04 | 13.92 | 10.77 | 14.17 | 13.82 | 13.82 | 13.82 | 13.82 | 13.82 |
| Capital Expenditure | -104.4 | -112.0 | -337.6 | -284.9 | -279.6 | -335.6 | -401.3 | -479.8 | -573.7 | -685.9 |
| Capital Expenditure, % | -1.54 | -1.25 | -3.09 | -2.3 | -2.04 | -2.04 | -2.04 | -2.04 | -2.04 | -2.04 |
| Tax Rate, % | 25.58 | 25.58 | 25.58 | 25.58 | 25.58 | 25.58 | 25.58 | 25.58 | 25.58 | 25.58 |
| EBITAT | 605.8 | 847.6 | 1,360.5 | 1,633.5 | 1,766.7 | 1,868.3 | 2,233.9 | 2,670.9 | 3,193.4 | 3,818.2 |
| Depreciation | ||||||||||
| Changes in Account Receivables | ||||||||||
| Changes in Inventories | ||||||||||
| Changes in Accounts Payable | ||||||||||
| Capital Expenditure | ||||||||||
| UFCF | -342.4 | 822.5 | 890.1 | 1,058.9 | 1,690.7 | 1,323.7 | 1,682.5 | 2,011.7 | 2,405.2 | 2,875.8 |
| WACC, % | 5.35 | 5.35 | 5.35 | 5.35 | 5.35 | 5.35 | 5.35 | 5.35 | 5.35 | 5.35 |
| PV UFCF | ||||||||||
| SUM PV UFCF | 8,661.0 | |||||||||
| Long Term Growth Rate, % | 4.00 | |||||||||
| Free cash flow (T + 1) | 2,991 | |||||||||
| Terminal Value | 221,193 | |||||||||
| Present Terminal Value | 170,433 | |||||||||
| Enterprise Value | 179,094 | |||||||||
| Net Debt | -749 | |||||||||
| Equity Value | 179,843 | |||||||||
| Diluted Shares Outstanding, MM | 15 | |||||||||
| Equity Value Per Share | 11,686.70 |
Benefits You Will Receive
- Genuine ESABINDIANS Financials: Access comprehensive historical and projected data for precise valuation.
- Customizable Inputs: Easily adjust WACC, tax rates, revenue growth, and capital expenditure settings.
- Automated Calculations: Dynamic computations for intrinsic value and NPV are provided.
- Scenario Analysis: Explore various scenarios to assess ESAB India's potential future performance.
- User-Friendly and Clear Design: Designed for professionals while remaining user-friendly for novices.
Key Features
- Accurate Financial Data: Access reliable historical information and future estimates for ESAB India Limited (ESABINDIANS).
- Customizable Forecast Parameters: Modify highlighted cells to adjust WACC, growth rates, and profit margins.
- Real-Time Calculations: Automatic updates for DCF, Net Present Value (NPV), and cash flow assessments.
- Interactive Dashboard: User-friendly charts and summaries to help visualize your valuation outcomes.
- Designed for All Users: A straightforward and intuitive layout tailored for investors, CFOs, and consultants alike.
How It Functions
- 1. Access the Template: Download and open the Excel file containing ESAB India Limited's (ESABINDIANS) preloaded data.
- 2. Adjust Assumptions: Modify essential inputs such as growth rates, WACC, and capital expenditures.
- 3. View Results Immediately: The DCF model automatically calculates intrinsic value and NPV.
- 4. Evaluate Scenarios: Analyze different valuation outcomes by comparing multiple forecasts.
- 5. Utilize with Assurance: Present professional valuation insights to back your decisions.
Why Choose This Calculator for ESAB India Limited (ESABINDIANS)?
- Designed for Professionals: A sophisticated tool tailored for analysts, CFOs, and consultants.
- Comprehensive Data: ESAB India's historical and projected financials preloaded for precision.
- Flexible Scenario Analysis: Effortlessly simulate various forecasts and assumptions.
- Transparent Results: Automatically computes intrinsic value, NPV, and essential metrics.
- User-Friendly: Guided, step-by-step instructions to facilitate your experience.
Who Can Benefit from ESAB India Limited (ESABINDIANS)?
- Investors: Gain confidence in your investment choices with our advanced valuation tools tailored for precision.
- Financial Analysts: Streamline your workflow with our customizable DCF model designed for efficiency.
- Consultants: Effortlessly modify templates for impactful client presentations and comprehensive reports.
- Finance Enthusiasts: Enhance your knowledge of valuation practices through practical, real-world applications.
- Educators and Students: Utilize this tool as a hands-on resource for finance courses and academic projects.
Contents of the Template
- Historical Data: Features ESAB India Limited’s past financial performance and baseline projections.
- DCF and Levered DCF Models: Comprehensive templates for determining the intrinsic value of ESAB India Limited (ESABINDIANS).
- WACC Sheet: Ready-made calculations for the Weighted Average Cost of Capital.
- Editable Inputs: Adjust essential drivers such as growth rates, EBITDA percentage, and CAPEX assumptions.
- Quarterly and Annual Statements: A thorough analysis of ESAB India Limited’s financials.
- Interactive Dashboard: Dynamically visualize valuation outcomes and projections.
Disclaimer
All information, articles, and product details provided on this website are for general informational and educational purposes only. We do not claim any ownership over, nor do we intend to infringe upon, any trademarks, copyrights, logos, brand names, or other intellectual property mentioned or depicted on this site. Such intellectual property remains the property of its respective owners, and any references here are made solely for identification or informational purposes, without implying any affiliation, endorsement, or partnership.
We make no representations or warranties, express or implied, regarding the accuracy, completeness, or suitability of any content or products presented. Nothing on this website should be construed as legal, tax, investment, financial, medical, or other professional advice. In addition, no part of this site—including articles or product references—constitutes a solicitation, recommendation, endorsement, advertisement, or offer to buy or sell any securities, franchises, or other financial instruments, particularly in jurisdictions where such activity would be unlawful.
All content is of a general nature and may not address the specific circumstances of any individual or entity. It is not a substitute for professional advice or services. Any actions you take based on the information provided here are strictly at your own risk. You accept full responsibility for any decisions or outcomes arising from your use of this website and agree to release us from any liability in connection with your use of, or reliance upon, the content or products found herein.