
|
Esso S.A.F. (Es.PA) Valoración de DCF |
Completamente Editable: Adáptelo A Sus Necesidades En Excel O Sheets
Diseño Profesional: Plantillas Confiables Y Estándares De La Industria
Predeterminadas Para Un Uso Rápido Y Eficiente
Compatible con MAC / PC, completamente desbloqueado
No Se Necesita Experiencia; Fáciles De Seguir
Esso S.A.F. (ES.PA) Bundle
Explore las perspectivas financieras de Esso S.A.F. (EspA) ¡Con nuestra calculadora DCF fácil de usar! Ingrese sus proyecciones para el crecimiento, los márgenes y los gastos para calcular el valor intrínseco de Esso S.A.F. (EspA) y mejorar su enfoque de inversión.
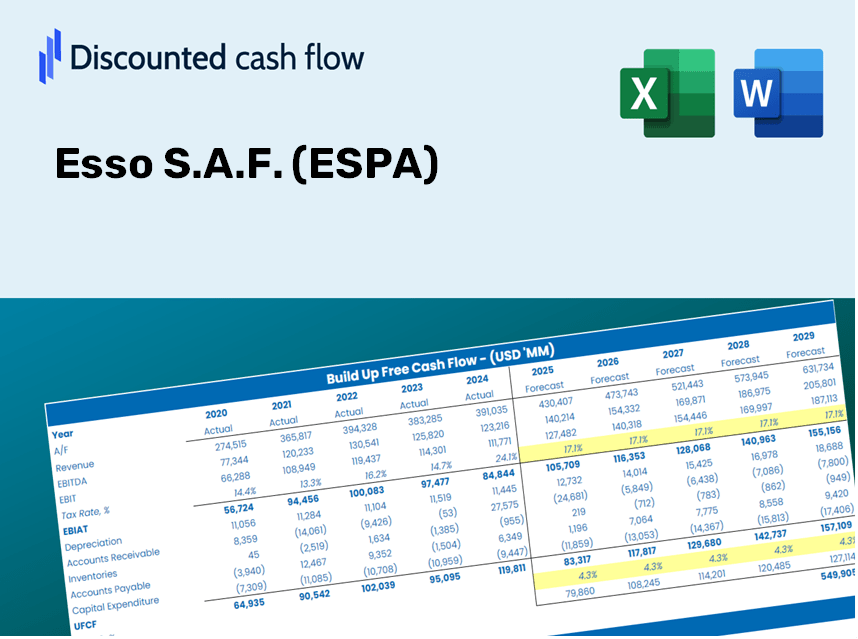
Discounted Cash Flow (DCF) - (USD MM)
| Year | AY1 2020 |
AY2 2021 |
AY3 2022 |
AY4 2023 |
AY5 2024 |
FY1 2025 |
FY2 2026 |
FY3 2027 |
FY4 2028 |
FY5 2029 |
|---|---|---|---|---|---|---|---|---|---|---|
| Revenue | 10,382.8 | 15,277.8 | 24,936.1 | 19,240.3 | 17,944.0 | 21,568.0 | 25,923.9 | 31,159.4 | 37,452.4 | 45,016.3 |
| Revenue Growth, % | 0 | 47.15 | 63.22 | -22.84 | -6.74 | 20.2 | 20.2 | 20.2 | 20.2 | 20.2 |
| EBITDA | -697.8 | 771.4 | 1,101.8 | 787.1 | 211.5 | 345.8 | 415.6 | 499.6 | 600.5 | 721.7 |
| EBITDA, % | -6.72 | 5.05 | 4.42 | 4.09 | 1.18 | 1.6 | 1.6 | 1.6 | 1.6 | 1.6 |
| Depreciation | 108.7 | 69.1 | 95.1 | 76.4 | 74.2 | 116.1 | 139.5 | 167.7 | 201.6 | 242.3 |
| Depreciation, % | 1.05 | 0.45229 | 0.38137 | 0.39708 | 0.41351 | 0.53824 | 0.53824 | 0.53824 | 0.53824 | 0.53824 |
| EBIT | -806.5 | 702.3 | 1,006.7 | 710.7 | 137.3 | 229.7 | 276.1 | 331.9 | 398.9 | 479.5 |
| EBIT, % | -7.77 | 4.6 | 4.04 | 3.69 | 0.76516 | 1.07 | 1.07 | 1.07 | 1.07 | 1.07 |
| Total Cash | 9.2 | 411.0 | .0 | 1,046.9 | 1,495.6 | 714.1 | 858.3 | 1,031.7 | 1,240.0 | 1,490.5 |
| Total Cash, percent | .0 | .0 | .0 | .0 | .0 | .0 | .0 | .0 | .0 | .0 |
| Account Receivables | 577.6 | 956.0 | 1,795.4 | 1,022.4 | 1,108.6 | 1,316.2 | 1,582.0 | 1,901.5 | 2,285.5 | 2,747.1 |
| Account Receivables, % | 5.56 | 6.26 | 7.2 | 5.31 | 6.18 | 6.1 | 6.1 | 6.1 | 6.1 | 6.1 |
| Inventories | 997.2 | 1,492.8 | 1,812.5 | 1,578.4 | 1,192.5 | 1,789.9 | 2,151.3 | 2,585.8 | 3,108.0 | 3,735.7 |
| Inventories, % | 9.6 | 9.77 | 7.27 | 8.2 | 6.65 | 8.3 | 8.3 | 8.3 | 8.3 | 8.3 |
| Accounts Payable | 783.2 | 1,461.0 | 761.9 | 1,249.0 | 1,286.3 | 1,458.9 | 1,753.6 | 2,107.7 | 2,533.4 | 3,045.0 |
| Accounts Payable, % | 7.54 | 9.56 | 3.06 | 6.49 | 7.17 | 6.76 | 6.76 | 6.76 | 6.76 | 6.76 |
| Capital Expenditure | -37.6 | -30.8 | -41.3 | -59.5 | -100.2 | -68.9 | -82.8 | -99.5 | -119.6 | -143.8 |
| Capital Expenditure, % | -0.36214 | -0.2016 | -0.16562 | -0.30925 | -0.5584 | -0.3194 | -0.3194 | -0.3194 | -0.3194 | -0.3194 |
| Tax Rate, % | 22.43 | 22.43 | 22.43 | 22.43 | 22.43 | 22.43 | 22.43 | 22.43 | 22.43 | 22.43 |
| EBITAT | -738.2 | 574.0 | 721.1 | 682.9 | 106.5 | 192.3 | 231.1 | 277.8 | 333.9 | 401.3 |
| Depreciation | ||||||||||
| Changes in Account Receivables | ||||||||||
| Changes in Inventories | ||||||||||
| Changes in Accounts Payable | ||||||||||
| Capital Expenditure | ||||||||||
| UFCF | -1,458.7 | 416.1 | -1,083.3 | 2,194.0 | 417.5 | -392.8 | -44.8 | -53.8 | -64.7 | -77.8 |
| WACC, % | 4.76 | 4.74 | 4.72 | 4.77 | 4.73 | 4.74 | 4.74 | 4.74 | 4.74 | 4.74 |
| PV UFCF | ||||||||||
| SUM PV UFCF | -578.2 | |||||||||
| Long Term Growth Rate, % | 0.50 | |||||||||
| Free cash flow (T + 1) | -78 | |||||||||
| Terminal Value | -1,842 | |||||||||
| Present Terminal Value | -1,461 | |||||||||
| Enterprise Value | -2,039 | |||||||||
| Net Debt | -1,479 | |||||||||
| Equity Value | -560 | |||||||||
| Diluted Shares Outstanding, MM | 13 | |||||||||
| Equity Value Per Share | -43.59 |
What You Will Receive
- Customizable Excel Template: A fully adjustable Excel-based DCF Calculator featuring pre-filled real Esso S.A.F. (ESPA) financials.
- Actual Market Data: Access to historical data along with forward-looking estimates (displayed in the highlighted cells).
- Flexible Forecasting: Modify forecast assumptions such as revenue growth, EBITDA %, and WACC.
- Instant Calculations: See the immediate effects of your inputs on the valuation of Esso S.A.F. (ESPA).
- Professional Resource: Designed specifically for investors, CFOs, consultants, and financial analysts.
- Intuitive Interface: Organized for simplicity and ease of navigation, complete with step-by-step guidance.
Key Features
- Pre-Loaded Data: Historical financial statements and forecasts for Esso S.A.F. (ESPA).
- Fully Customizable Inputs: Adjust WACC, tax rates, revenue growth, and EBITDA margins as needed.
- Real-Time Results: Instantly view the recalculated intrinsic value of Esso S.A.F. (ESPA).
- Intuitive Visual Outputs: Dashboard charts offer a clear presentation of valuation results and essential metrics.
- Designed for Precision: A professional-grade tool tailored for analysts, investors, and finance professionals.
How It Works
- Step 1: Download the Excel spreadsheet.
- Step 2: Examine the pre-filled Esso S.A.F. (ESPA) data (both historical and forecasted).
- Step 3: Modify key assumptions (highlighted in yellow) according to your analysis.
- Step 4: Check the automatic recalculations of Esso S.A.F.'s (ESPA) intrinsic value.
- Step 5: Utilize the results for your investment strategies or reporting needs.
Why Choose the Esso S.A.F. (ESPA) Calculator?
- All-in-One Tool: Combines DCF, WACC, and financial ratio analyses into a single resource.
- Flexible Inputs: Modify the yellow-highlighted cells to explore different scenarios.
- In-Depth Analysis: Automatically computes Esso S.A.F.'s intrinsic value and Net Present Value.
- Preloaded Information: Access historical and projected data for reliable benchmarks.
- Expert-Level Quality: Perfect for financial analysts, investors, and business advisors.
Who Can Benefit from This Product?
- Finance Students: Master valuation methods and apply them with real-world data.
- Researchers: Integrate advanced financial models into your academic projects.
- Investors: Validate your hypotheses and evaluate valuation metrics for Esso S.A.F. (ESPA) stock.
- Financial Analysts: Enhance your analysis process with a ready-to-use, customizable DCF model.
- Entrepreneurs: Learn from the analytical approaches used for large public firms like Esso S.A.F. (ESPA).
Contents of the Template
- Preloaded ESPA Data: Historical and projected financial metrics, including revenue, EBIT, and capital expenditures.
- DCF and WACC Models: High-quality spreadsheets for determining intrinsic value and Weighted Average Cost of Capital.
- Editable Inputs: Yellow-highlighted fields for modifying revenue growth, tax rates, and discount rates.
- Financial Statements: Detailed annual and quarterly financial reports for in-depth analysis.
- Key Ratios: Metrics on profitability, leverage, and efficiency to assess performance.
- Dashboard and Charts: Visual representations of valuation results and assumptions.
Disclaimer
All information, articles, and product details provided on this website are for general informational and educational purposes only. We do not claim any ownership over, nor do we intend to infringe upon, any trademarks, copyrights, logos, brand names, or other intellectual property mentioned or depicted on this site. Such intellectual property remains the property of its respective owners, and any references here are made solely for identification or informational purposes, without implying any affiliation, endorsement, or partnership.
We make no representations or warranties, express or implied, regarding the accuracy, completeness, or suitability of any content or products presented. Nothing on this website should be construed as legal, tax, investment, financial, medical, or other professional advice. In addition, no part of this site—including articles or product references—constitutes a solicitation, recommendation, endorsement, advertisement, or offer to buy or sell any securities, franchises, or other financial instruments, particularly in jurisdictions where such activity would be unlawful.
All content is of a general nature and may not address the specific circumstances of any individual or entity. It is not a substitute for professional advice or services. Any actions you take based on the information provided here are strictly at your own risk. You accept full responsibility for any decisions or outcomes arising from your use of this website and agree to release us from any liability in connection with your use of, or reliance upon, the content or products found herein.