
|
Valoración de DCF de Exide Industries Limited (ExideInd.NS) |
Completamente Editable: Adáptelo A Sus Necesidades En Excel O Sheets
Diseño Profesional: Plantillas Confiables Y Estándares De La Industria
Predeterminadas Para Un Uso Rápido Y Eficiente
Compatible con MAC / PC, completamente desbloqueado
No Se Necesita Experiencia; Fáciles De Seguir
Exide Industries Limited (EXIDEIND.NS) Bundle
Ingementada para su precisión, nuestra calculadora DCF (ExideIndns) le permite evaluar la valoración de Exide Industries Limited utilizando datos financieros del mundo real, proporcionando una flexibilidad completa para modificar todos los parámetros esenciales para las proyecciones mejoradas.
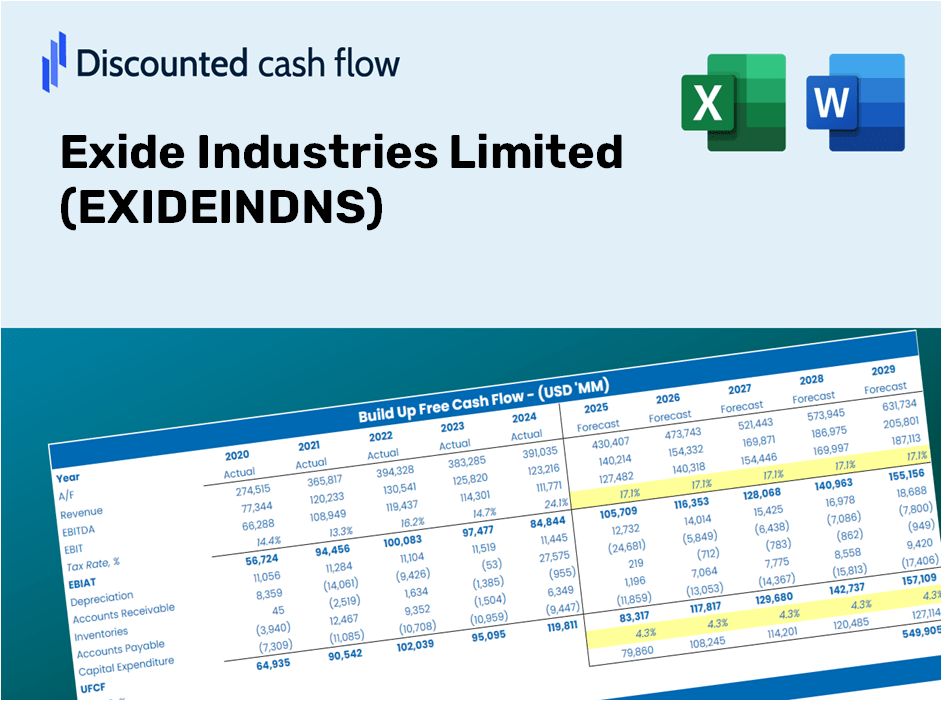
Discounted Cash Flow (DCF) - (USD MM)
| Year | AY1 2021 |
AY2 2022 |
AY3 2023 |
AY4 2024 |
AY5 2025 |
FY1 2026 |
FY2 2027 |
FY3 2028 |
FY4 2029 |
FY5 2030 |
|---|---|---|---|---|---|---|---|---|---|---|
| Revenue | 103,058.3 | 127,127.5 | 149,807.3 | 166,729.6 | 172,378.5 | 196,459.4 | 223,904.5 | 255,183.5 | 290,832.1 | 331,460.8 |
| Revenue Growth, % | 0 | 23.35 | 17.84 | 11.3 | 3.39 | 13.97 | 13.97 | 13.97 | 13.97 | 13.97 |
| EBITDA | 14,288.2 | 14,654.3 | 17,169.7 | 19,111.6 | 19,113.3 | 23,340.7 | 26,601.3 | 30,317.5 | 34,552.7 | 39,379.7 |
| EBITDA, % | 13.86 | 11.53 | 11.46 | 11.46 | 11.09 | 11.88 | 11.88 | 11.88 | 11.88 | 11.88 |
| Depreciation | 3,935.1 | 4,395.2 | 5,009.6 | 5,604.2 | 5,823.4 | 6,820.8 | 7,773.6 | 8,859.6 | 10,097.2 | 11,507.8 |
| Depreciation, % | 3.82 | 3.46 | 3.34 | 3.36 | 3.38 | 3.47 | 3.47 | 3.47 | 3.47 | 3.47 |
| EBIT | 10,353.1 | 10,259.1 | 12,160.1 | 13,507.4 | 13,289.9 | 16,519.9 | 18,827.7 | 21,457.9 | 24,455.5 | 27,871.9 |
| EBIT, % | 10.05 | 8.07 | 8.12 | 8.1 | 7.71 | 8.41 | 8.41 | 8.41 | 8.41 | 8.41 |
| Total Cash | 18,878.0 | 9,006.1 | 7,350.3 | 5,818.9 | 4,990.9 | 14,417.7 | 16,431.9 | 18,727.4 | 21,343.5 | 24,325.2 |
| Total Cash, percent | .0 | .0 | .0 | .0 | .0 | .0 | .0 | .0 | .0 | .0 |
| Account Receivables | 14,936.3 | 12,072.1 | 13,244.5 | 14,925.5 | 16,867.3 | 20,261.7 | 23,092.2 | 26,318.1 | 29,994.7 | 34,184.9 |
| Account Receivables, % | 14.49 | 9.5 | 8.84 | 8.95 | 9.79 | 10.31 | 10.31 | 10.31 | 10.31 | 10.31 |
| Inventories | 26,368.6 | 28,552.9 | 34,364.0 | 38,685.3 | 45,649.0 | 47,413.2 | 54,036.7 | 61,585.6 | 70,189.0 | 79,994.2 |
| Inventories, % | 25.59 | 22.46 | 22.94 | 23.2 | 26.48 | 24.13 | 24.13 | 24.13 | 24.13 | 24.13 |
| Accounts Payable | 23,736.7 | 18,463.3 | 18,556.1 | 27,077.4 | 33,449.6 | 33,628.9 | 38,326.8 | 43,681.0 | 49,783.2 | 56,737.8 |
| Accounts Payable, % | 23.03 | 14.52 | 12.39 | 16.24 | 19.4 | 17.12 | 17.12 | 17.12 | 17.12 | 17.12 |
| Capital Expenditure | -5,016.2 | -6,658.9 | -9,958.5 | -18,760.5 | -19,487.2 | -15,445.6 | -17,603.3 | -20,062.4 | -22,865.1 | -26,059.3 |
| Capital Expenditure, % | -4.87 | -5.24 | -6.65 | -11.25 | -11.3 | -7.86 | -7.86 | -7.86 | -7.86 | -7.86 |
| Tax Rate, % | 32.39 | 32.39 | 32.39 | 32.39 | 32.39 | 32.39 | 32.39 | 32.39 | 32.39 | 32.39 |
| EBITAT | 8,395.1 | 46,637.8 | 8,794.1 | 9,618.2 | 8,984.8 | 12,958.9 | 14,769.2 | 16,832.5 | 19,183.9 | 21,863.9 |
| Depreciation | ||||||||||
| Changes in Account Receivables | ||||||||||
| Changes in Inventories | ||||||||||
| Changes in Accounts Payable | ||||||||||
| Capital Expenditure | ||||||||||
| UFCF | -10,254.2 | 39,780.6 | -3,045.5 | -1,019.1 | -7,212.3 | -645.2 | 183.4 | 209.0 | 238.2 | 271.5 |
| WACC, % | 6.16 | 6.24 | 6.13 | 6.12 | 6.11 | 6.15 | 6.15 | 6.15 | 6.15 | 6.15 |
| PV UFCF | ||||||||||
| SUM PV UFCF | 118.7 | |||||||||
| Long Term Growth Rate, % | 3.50 | |||||||||
| Free cash flow (T + 1) | 281 | |||||||||
| Terminal Value | 10,591 | |||||||||
| Present Terminal Value | 7,858 | |||||||||
| Enterprise Value | 7,976 | |||||||||
| Net Debt | 18,359 | |||||||||
| Equity Value | -10,383 | |||||||||
| Diluted Shares Outstanding, MM | 850 | |||||||||
| Equity Value Per Share | -12.21 |
Benefits You Will Receive
- Genuine EXIDEINDNS Financials: Access to both historical and projected data for precise valuation.
- Customizable Parameters: Adjust WACC, tax rates, revenue growth, and capital expenditures to fit your analysis.
- Automated Calculations: Dynamic calculations of intrinsic value and NPV are provided.
- Scenario Testing: Explore various scenarios to assess the future performance of Exide Industries Limited.
- User-Friendly Design: Designed for professionals while remaining approachable for newcomers.
Key Features
- 🔍 Real-Life EXIDEINDNS Financials: Pre-filled historical and projected data for Exide Industries Limited.
- ✏️ Fully Customizable Inputs: Modify all essential parameters (yellow cells) such as WACC, growth %, and tax rates.
- 📊 Professional DCF Valuation: Integrated formulas calculate the intrinsic value of Exide Industries using the Discounted Cash Flow approach.
- ⚡ Instant Results: See Exide's valuation change instantly after making your adjustments.
- Scenario Analysis: Analyze and compare results for different financial assumptions side-by-side.
How It Functions
- 1. Access the Template: Download and open the Excel sheet containing Exide Industries Limited’s (EXIDEINDNS) preloaded data.
- 2. Modify Assumptions: Adjust key parameters such as growth rates, WACC, and capital expenditures.
- 3. Instant Results: The DCF model automatically computes the intrinsic value and NPV in real-time.
- 4. Analyze Scenarios: Evaluate various forecasts to investigate different valuation results.
- 5. Present with Assurance: Deliver professional valuation analyses to substantiate your decisions.
Why Opt for This Calculator?
- Designed for Experts: A sophisticated tool utilized by analysts, CFOs, and consultants in the field.
- Accurate Data: Historical and projected financials for Exide Industries Limited (EXIDEINDNS) included for precise analysis.
- Flexible Scenario Analysis: Effortlessly test various forecasts and assumptions.
- Transparent Results: Automatically computes intrinsic value, NPV, and essential metrics.
- User-Friendly: Comprehensive step-by-step instructions assist you throughout the process.
Who Can Benefit from This Product?
- Finance Students: Master valuation techniques and apply them to real data with Exide Industries Limited (EXIDEINDNS).
- Academics: Integrate professional valuation models into your curriculum or research projects.
- Investors: Challenge your assumptions and analyze valuation outcomes for Exide Industries Limited (EXIDEINDNS) stock.
- Analysts: Optimize your analysis process with a customizable DCF model tailored for Exide Industries Limited (EXIDEINDNS).
- Small Business Owners: Discover how large public companies like Exide Industries Limited (EXIDEINDNS) are evaluated in the market.
Contents of the Template
- Operating and Balance Sheet Data: Pre-filled historical data and forecasts for Exide Industries Limited (EXIDEINDNS), encompassing revenue, EBITDA, EBIT, and capital expenditures.
- WACC Calculation: A specialized sheet for calculating the Weighted Average Cost of Capital (WACC), featuring parameters such as Beta, risk-free rate, and share price.
- DCF Valuation (Unlevered and Levered): Editable Discounted Cash Flow models that showcase the intrinsic value along with comprehensive calculations.
- Financial Statements: Pre-loaded annual and quarterly financial statements to facilitate thorough analysis.
- Key Ratios: Presents essential profitability, leverage, and efficiency ratios for Exide Industries Limited (EXIDEINDNS).
- Dashboard and Charts: A visual overview of valuation outputs and assumptions, simplifying the analysis of results.
Disclaimer
All information, articles, and product details provided on this website are for general informational and educational purposes only. We do not claim any ownership over, nor do we intend to infringe upon, any trademarks, copyrights, logos, brand names, or other intellectual property mentioned or depicted on this site. Such intellectual property remains the property of its respective owners, and any references here are made solely for identification or informational purposes, without implying any affiliation, endorsement, or partnership.
We make no representations or warranties, express or implied, regarding the accuracy, completeness, or suitability of any content or products presented. Nothing on this website should be construed as legal, tax, investment, financial, medical, or other professional advice. In addition, no part of this site—including articles or product references—constitutes a solicitation, recommendation, endorsement, advertisement, or offer to buy or sell any securities, franchises, or other financial instruments, particularly in jurisdictions where such activity would be unlawful.
All content is of a general nature and may not address the specific circumstances of any individual or entity. It is not a substitute for professional advice or services. Any actions you take based on the information provided here are strictly at your own risk. You accept full responsibility for any decisions or outcomes arising from your use of this website and agree to release us from any liability in connection with your use of, or reliance upon, the content or products found herein.