
|
Valoración DCF de Extreme Networks, Inc. (EXTR) |
Completamente Editable: Adáptelo A Sus Necesidades En Excel O Sheets
Diseño Profesional: Plantillas Confiables Y Estándares De La Industria
Predeterminadas Para Un Uso Rápido Y Eficiente
Compatible con MAC / PC, completamente desbloqueado
No Se Necesita Experiencia; Fáciles De Seguir
Extreme Networks, Inc. (EXTR) Bundle
¡Descubra el verdadero potencial de Extreme Networks, Inc. (Extr) con nuestra calculadora DCF avanzada! Ajuste los supuestos clave, explore varios escenarios y evalúe cómo los cambios afectan la valoración de Extreme Networks, Inc. (extr), todo dentro de una sola plantilla de Excel.
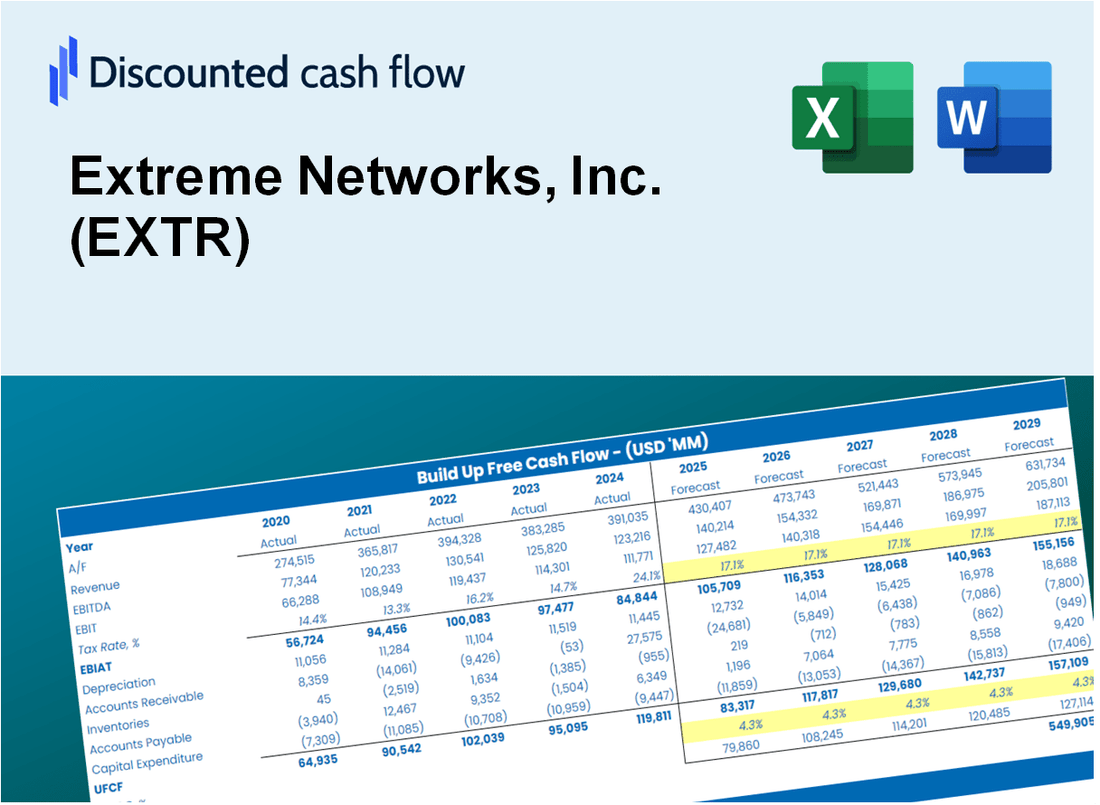
Discounted Cash Flow (DCF) - (USD MM)
| Year | AY1 2021 |
AY2 2022 |
AY3 2023 |
AY4 2024 |
AY5 2025 |
FY1 2026 |
FY2 2027 |
FY3 2028 |
FY4 2029 |
FY5 2030 |
|---|---|---|---|---|---|---|---|---|---|---|
| Revenue | 1,009.4 | 1,112.3 | 1,312.5 | 1,117.2 | 1,140.1 | 1,183.8 | 1,229.3 | 1,276.5 | 1,325.5 | 1,376.4 |
| Revenue Growth, % | 0 | 10.19 | 17.99 | -14.88 | 2.05 | 3.84 | 3.84 | 3.84 | 3.84 | 3.84 |
| EBITDA | 110.1 | 120.1 | 158.6 | -19.6 | 49.3 | 86.1 | 89.4 | 92.8 | 96.4 | 100.1 |
| EBITDA, % | 10.91 | 10.79 | 12.09 | -1.76 | 4.32 | 7.27 | 7.27 | 7.27 | 7.27 | 7.27 |
| Depreciation | 77.1 | 55.1 | 47.1 | 29.4 | 29.1 | 50.6 | 52.5 | 54.5 | 56.6 | 58.8 |
| Depreciation, % | 7.63 | 4.95 | 3.59 | 2.64 | 2.55 | 4.27 | 4.27 | 4.27 | 4.27 | 4.27 |
| EBIT | 33.0 | 65.0 | 111.5 | -49.1 | 20.2 | 35.5 | 36.9 | 38.3 | 39.7 | 41.3 |
| EBIT, % | 3.27 | 5.84 | 8.49 | -4.39 | 1.77 | 3 | 3 | 3 | 3 | 3 |
| Total Cash | 246.9 | 194.5 | 234.8 | 156.7 | 231.7 | 223.0 | 231.6 | 240.5 | 249.7 | 259.3 |
| Total Cash, percent | .0 | .0 | .0 | .0 | .0 | .0 | .0 | .0 | .0 | .0 |
| Account Receivables | 156.5 | 184.1 | 182.0 | 89.5 | 126.7 | 154.0 | 159.9 | 166.1 | 172.4 | 179.1 |
| Account Receivables, % | 15.5 | 16.55 | 13.87 | 8.01 | 11.11 | 13.01 | 13.01 | 13.01 | 13.01 | 13.01 |
| Inventories | 32.9 | 49.2 | 89.0 | 141.0 | 102.6 | 85.4 | 88.7 | 92.1 | 95.7 | 99.3 |
| Inventories, % | 3.26 | 4.43 | 6.78 | 12.62 | 9 | 7.22 | 7.22 | 7.22 | 7.22 | 7.22 |
| Accounts Payable | 60.1 | 84.3 | 99.7 | 51.4 | 63.9 | 74.2 | 77.1 | 80.0 | 83.1 | 86.3 |
| Accounts Payable, % | 5.96 | 7.58 | 7.6 | 4.6 | 5.61 | 6.27 | 6.27 | 6.27 | 6.27 | 6.27 |
| Capital Expenditure | -17.2 | -15.4 | -13.8 | -18.1 | -24.7 | -18.8 | -19.5 | -20.2 | -21.0 | -21.8 |
| Capital Expenditure, % | -1.7 | -1.39 | -1.05 | -1.62 | -2.17 | -1.59 | -1.59 | -1.59 | -1.59 | -1.59 |
| Tax Rate, % | 274.75 | 274.75 | 274.75 | 274.75 | 274.75 | 274.75 | 274.75 | 274.75 | 274.75 | 274.75 |
| EBITAT | 6.3 | 55.1 | 92.5 | -54.4 | -35.3 | 20.4 | 21.1 | 22.0 | 22.8 | 23.7 |
| Depreciation | ||||||||||
| Changes in Account Receivables | ||||||||||
| Changes in Inventories | ||||||||||
| Changes in Accounts Payable | ||||||||||
| Capital Expenditure | ||||||||||
| UFCF | -63.1 | 75.0 | 103.5 | -50.9 | -17.1 | 52.3 | 47.8 | 49.7 | 51.6 | 53.6 |
| WACC, % | 11.31 | 11.67 | 11.66 | 11.75 | 11.2 | 11.52 | 11.52 | 11.52 | 11.52 | 11.52 |
| PV UFCF | ||||||||||
| SUM PV UFCF | 185.5 | |||||||||
| Long Term Growth Rate, % | 4.00 | |||||||||
| Free cash flow (T + 1) | 56 | |||||||||
| Terminal Value | 741 | |||||||||
| Present Terminal Value | 429 | |||||||||
| Enterprise Value | 615 | |||||||||
| Net Debt | -8 | |||||||||
| Equity Value | 623 | |||||||||
| Diluted Shares Outstanding, MM | 132 | |||||||||
| Equity Value Per Share | 4.71 |
What You Will Get
- Real EXTR Financial Data: Pre-filled with Extreme Networks’ historical and projected data for precise analysis.
- Fully Editable Template: Modify key inputs like revenue growth, WACC, and EBITDA % with ease.
- Automatic Calculations: See Extreme Networks’ intrinsic value update instantly based on your changes.
- Professional Valuation Tool: Designed for investors, analysts, and consultants seeking accurate DCF results.
- User-Friendly Design: Simple structure and clear instructions for all experience levels.
Key Features
- Customizable Forecast Inputs: Adjust essential parameters such as revenue growth, EBITDA %, and capital expenditures.
- Instant DCF Valuation: Automatically computes intrinsic value, NPV, and other financial metrics in real time.
- High-Precision Accuracy: Leverages Extreme Networks' actual financial data for credible valuation results.
- Effortless Scenario Analysis: Easily explore various assumptions and evaluate different outcomes.
- Efficiency Booster: Streamline the valuation process without needing to create complex models from the ground up.
How It Works
- Download the Template: Gain immediate access to the Excel-based EXTR DCF Calculator.
- Input Your Assumptions: Modify the yellow-highlighted cells for growth rates, WACC, margins, and additional factors.
- Instant Calculations: The model automatically recalculates Extreme Networks’ intrinsic value.
- Test Scenarios: Experiment with various assumptions to assess potential valuation impacts.
- Analyze and Decide: Utilize the outcomes to inform your investment or financial analysis.
Why Choose This Calculator for Extreme Networks, Inc. (EXTR)?
- Accurate Data: Access to precise financials of Extreme Networks ensures dependable valuation outcomes.
- Customizable: Tailor essential parameters such as growth rates, WACC, and tax rates to fit your financial forecasts.
- Time-Saving: Pre-constructed calculations save you the effort of starting from the ground up.
- Professional-Grade Tool: Crafted specifically for investors, analysts, and consultants in the tech sector.
- User-Friendly: An intuitive design and guided instructions make it accessible for users of all experience levels.
Who Should Use This Product?
- Professional Investors: Develop comprehensive and accurate valuation models for analyzing Extreme Networks, Inc. (EXTR) within their portfolios.
- Corporate Finance Teams: Evaluate valuation scenarios to inform strategic decisions for their organizations.
- Consultants and Advisors: Deliver precise valuation insights regarding Extreme Networks, Inc. (EXTR) to their clients.
- Students and Educators: Utilize real-world data to enhance learning and practice in financial modeling.
- Tech Enthusiasts: Gain insights into how tech companies like Extreme Networks, Inc. (EXTR) are valued in the marketplace.
What the Template Contains
- Preloaded EXTR Data: Historical and projected financial data, including revenue, EBIT, and capital expenditures.
- DCF and WACC Models: Professional-grade sheets for calculating intrinsic value and Weighted Average Cost of Capital.
- Editable Inputs: Yellow-highlighted cells for adjusting revenue growth, tax rates, and discount rates.
- Financial Statements: Comprehensive annual and quarterly financials for deeper analysis.
- Key Ratios: Profitability, leverage, and efficiency ratios to evaluate performance.
- Dashboard and Charts: Visual summaries of valuation outcomes and assumptions.
Disclaimer
All information, articles, and product details provided on this website are for general informational and educational purposes only. We do not claim any ownership over, nor do we intend to infringe upon, any trademarks, copyrights, logos, brand names, or other intellectual property mentioned or depicted on this site. Such intellectual property remains the property of its respective owners, and any references here are made solely for identification or informational purposes, without implying any affiliation, endorsement, or partnership.
We make no representations or warranties, express or implied, regarding the accuracy, completeness, or suitability of any content or products presented. Nothing on this website should be construed as legal, tax, investment, financial, medical, or other professional advice. In addition, no part of this site—including articles or product references—constitutes a solicitation, recommendation, endorsement, advertisement, or offer to buy or sell any securities, franchises, or other financial instruments, particularly in jurisdictions where such activity would be unlawful.
All content is of a general nature and may not address the specific circumstances of any individual or entity. It is not a substitute for professional advice or services. Any actions you take based on the information provided here are strictly at your own risk. You accept full responsibility for any decisions or outcomes arising from your use of this website and agree to release us from any liability in connection with your use of, or reliance upon, the content or products found herein.