
|
Valoración DCF de EZFill Holdings Inc. (EZFL) |
Completamente Editable: Adáptelo A Sus Necesidades En Excel O Sheets
Diseño Profesional: Plantillas Confiables Y Estándares De La Industria
Predeterminadas Para Un Uso Rápido Y Eficiente
Compatible con MAC / PC, completamente desbloqueado
No Se Necesita Experiencia; Fáciles De Seguir
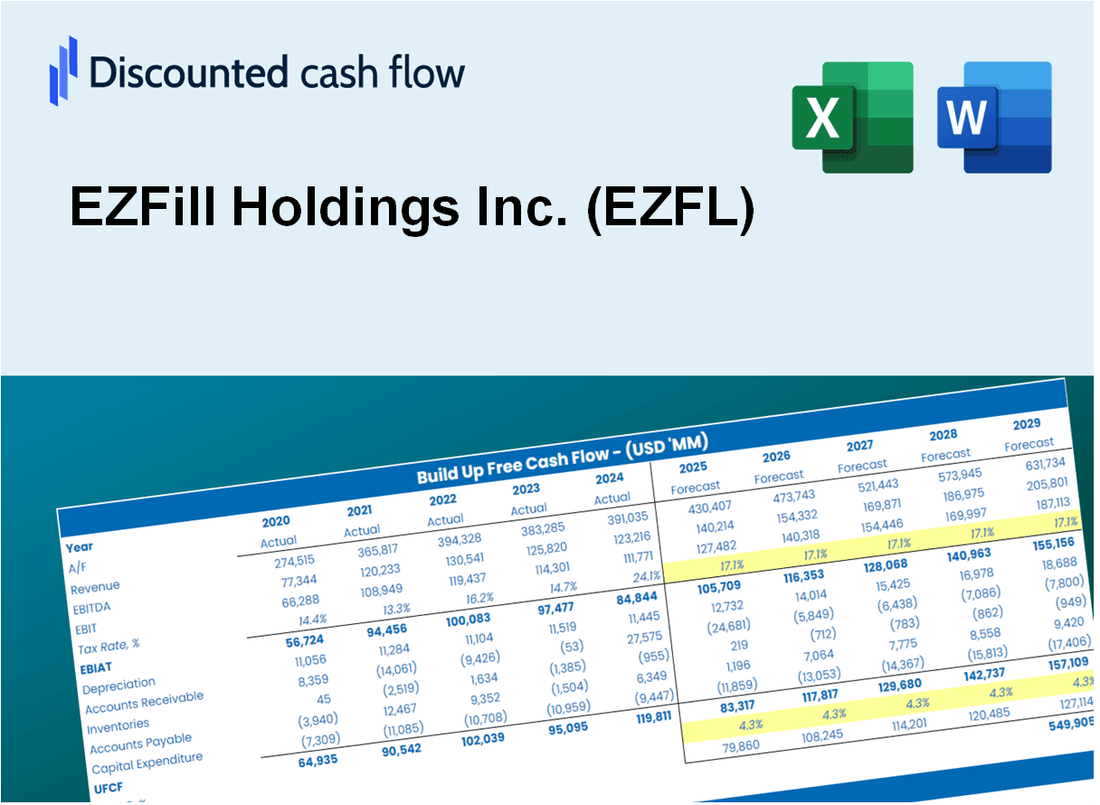
EZFill Holdings Inc. (EZFL) Bundle
¡Explore el futuro financiero de EZFill Holdings Inc. (EZFL) con nuestra calculadora DCF fácil de usar! Ingrese sus proyecciones para el crecimiento, los márgenes y los gastos para determinar el valor intrínseco de EZFill Holdings Inc. (EZFL) y mejorar su enfoque de inversión.
What You Will Get
- Genuine EZFill Data: Preloaded financials – from revenue to EBIT – based on actual and projected figures for EZFill Holdings Inc. (EZFL).
- Complete Customization: Modify all essential parameters (yellow cells) such as WACC, growth %, and tax rates to suit your analysis.
- Immediate Valuation Updates: Automatic recalculations to assess the effects of changes on EZFill's fair value.
- Flexible Excel Template: Designed for quick adjustments, scenario testing, and comprehensive projections.
- Efficient and Precise: Eliminate the need to build models from scratch while ensuring accuracy and adaptability.
Key Features
- 🔍 Real-Life EZFL Financials: Pre-filled historical and projected data for EZFill Holdings Inc. (EZFL).
- ✏️ Fully Customizable Inputs: Adjust all critical parameters (yellow cells) like WACC, growth %, and tax rates.
- 📊 Professional DCF Valuation: Built-in formulas calculate EZFill's intrinsic value using the Discounted Cash Flow method.
- ⚡ Instant Results: Visualize EZFill's valuation instantly after making changes.
- Scenario Analysis: Test and compare outcomes for various financial assumptions side-by-side.
How It Works
- Step 1: Download the prebuilt Excel template featuring EZFill Holdings Inc. (EZFL) data.
- Step 2: Navigate through the pre-filled sheets to familiarize yourself with the essential metrics.
- Step 3: Modify forecasts and assumptions in the editable yellow cells (WACC, growth, margins).
- Step 4: Instantly see the recalculated results, including EZFill Holdings Inc.'s (EZFL) intrinsic value.
- Step 5: Make informed investment decisions or create reports based on the outputs.
Why Choose EZFill Holdings Inc. (EZFL) Calculator?
- User-Friendly Interface: Perfect for both novice and experienced users.
- Customizable Inputs: Adjust parameters to suit your specific analysis needs.
- Real-Time Adjustments: Watch as EZFill's valuation updates instantly with your changes.
- Preloaded Data: Comes with EZFill's actual financial metrics for immediate evaluation.
- Preferred by Experts: Utilized by investors and analysts for strategic decision-making.
Who Should Use EZFill Holdings Inc. (EZFL)?
- Real Estate Investors: Discover innovative filling solutions and assess their impact on property value.
- Industry Professionals: Integrate cutting-edge technology into your projects or research.
- Contractors: Evaluate the efficiency of EZFill's services for your construction needs.
- Financial Analysts: Utilize a comprehensive model to analyze EZFill's market performance.
- Entrepreneurs: Learn about the operational strategies of a growing company in the filling industry.
What the Template Contains
- Historical Data: Includes EZFill Holdings Inc.’s (EZFL) past financials and baseline forecasts.
- DCF and Levered DCF Models: Detailed templates to calculate EZFill Holdings Inc.’s (EZFL) intrinsic value.
- WACC Sheet: Pre-built calculations for Weighted Average Cost of Capital.
- Editable Inputs: Modify key drivers like growth rates, EBITDA %, and CAPEX assumptions.
- Quarterly and Annual Statements: A complete breakdown of EZFill Holdings Inc.’s (EZFL) financials.
- Interactive Dashboard: Visualize valuation results and projections dynamically.
Disclaimer
All information, articles, and product details provided on this website are for general informational and educational purposes only. We do not claim any ownership over, nor do we intend to infringe upon, any trademarks, copyrights, logos, brand names, or other intellectual property mentioned or depicted on this site. Such intellectual property remains the property of its respective owners, and any references here are made solely for identification or informational purposes, without implying any affiliation, endorsement, or partnership.
We make no representations or warranties, express or implied, regarding the accuracy, completeness, or suitability of any content or products presented. Nothing on this website should be construed as legal, tax, investment, financial, medical, or other professional advice. In addition, no part of this site—including articles or product references—constitutes a solicitation, recommendation, endorsement, advertisement, or offer to buy or sell any securities, franchises, or other financial instruments, particularly in jurisdictions where such activity would be unlawful.
All content is of a general nature and may not address the specific circumstances of any individual or entity. It is not a substitute for professional advice or services. Any actions you take based on the information provided here are strictly at your own risk. You accept full responsibility for any decisions or outcomes arising from your use of this website and agree to release us from any liability in connection with your use of, or reliance upon, the content or products found herein.