
|
Análisis de 5 Fuerzas de First American Financial Corporation (FAF): [Actualizado en Ene-2025] |
Completamente Editable: Adáptelo A Sus Necesidades En Excel O Sheets
Diseño Profesional: Plantillas Confiables Y Estándares De La Industria
Predeterminadas Para Un Uso Rápido Y Eficiente
Compatible con MAC / PC, completamente desbloqueado
No Se Necesita Experiencia; Fáciles De Seguir
First American Financial Corporation (FAF) Bundle
En el panorama dinámico del seguro de título, First American Financial Corporation (FAF) navega por un complejo ecosistema de fuerzas competitivas que dan forma a su posicionamiento estratégico. A medida que la tecnología transforma las transacciones inmobiliarias y la dinámica del mercado evolucionan, la comprensión de la intrincada interacción de la potencia de los proveedores, la dinámica del cliente, la rivalidad competitiva, los sustitutos potenciales y las barreras de entrada se vuelven cruciales para comprender la estrategia competitiva de FAF en 2024. Esta inmersión profunda en los cinco fuerzas de Michael Porter se vuelve crucial. Revela los desafíos y oportunidades matizados que definen la resiliencia del mercado y el potencial estratégico de la compañía.
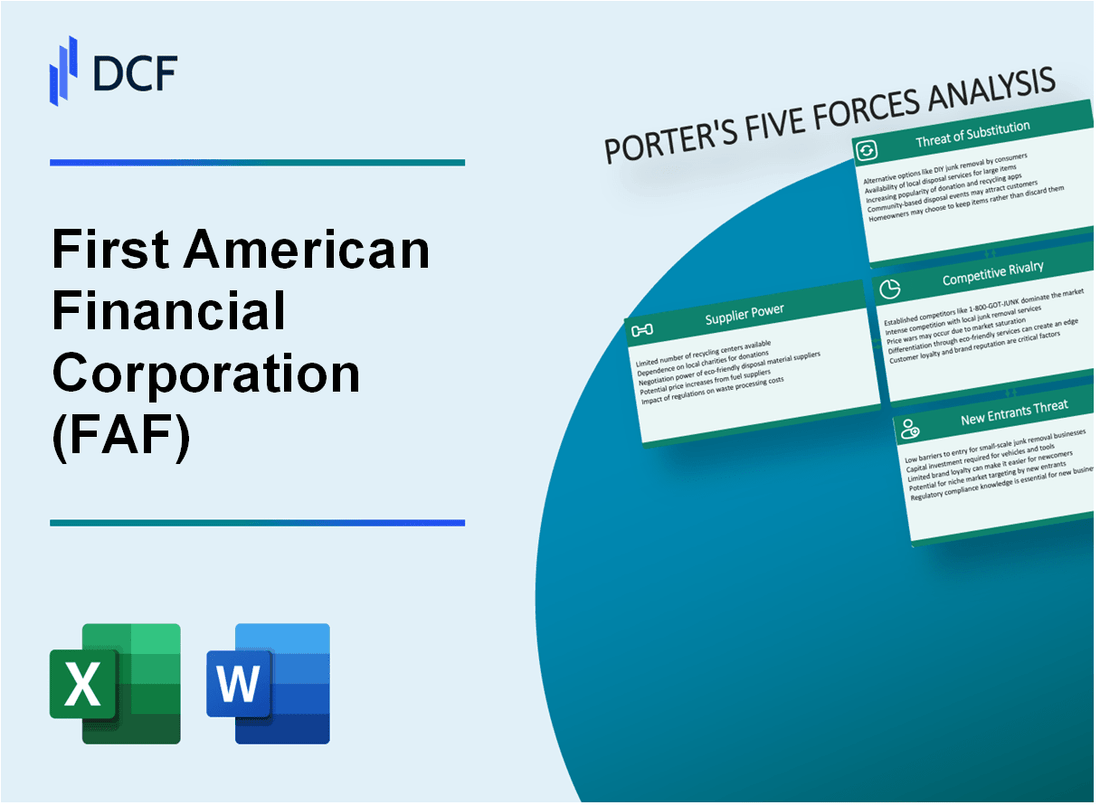
First American Financial Corporation (FAF) - Las cinco fuerzas de Porter: poder de negociación de los proveedores
Número limitado de software de seguro de título especializado y proveedores de datos
A partir de 2024, el mercado de tecnología de seguros de título muestra un panorama concentrado con aproximadamente 3-4 proveedores de software dominantes. First American Financial Corporation se basa en un ecosistema de proveedores estrechos para la infraestructura de tecnología crítica.
| Proveedores de tecnología clave | Cuota de mercado | Ingresos anuales |
|---|---|---|
| Datatrace | 38% | $ 124.5 millones |
| Caballero negro | 29% | $ 183.2 millones |
| Simplificar | 18% | $ 67.3 millones |
Dependencia de los datos de bienes raíces y los proveedores de tecnología
First American Financial Corporation demuestra una dependencia tecnológica significativa con las relaciones de los proveedores que representan aproximadamente el 62% de su adquisición de infraestructura tecnológica.
- Valor promedio del contrato con proveedores de tecnología: $ 3.4 millones anuales
- Duración de la relación del proveedor de tecnología: 4-7 años
- Porcentaje de sistemas de misión crítica subcontratada: 47%
Concentración de tecnología clave y fuentes de suministro de datos
El mercado de tecnología de seguros de título exhibe una alta concentración, con tres proveedores principales que controlan el 85% de las soluciones de software especializadas.
| Métricas de concentración de proveedores | Porcentaje |
|---|---|
| Control del mercado de los 3 proveedores principales | 85% |
| Proveedores especializados únicos | 6 |
| Inversión tecnológica anual | $ 42.7 millones |
Costos de conmutación moderados para las relaciones con los proveedores
First American Financial Corporation enfrenta costos de cambio moderados estimados entre $ 1.2 millones a $ 3.5 millones por migración de plataforma de tecnología.
- Costo promedio de migración de tecnología: $ 2.4 millones
- Tiempo de implementación para la nueva plataforma de tecnología: 8-12 meses
- Pérdida potencial de productividad durante la transición: 22-35%
First American Financial Corporation (FAF) - Las cinco fuerzas de Porter: poder de negociación de los clientes
Concentración del mercado de prestamistas inmobiliarios e hipotecarios
A partir del cuarto trimestre de 2023, First American Financial Corporation atiende a aproximadamente el 87% de los 100 principales prestamistas hipotecarios en los Estados Unidos. Los 5 principales prestamistas hipotecarios representan el 51.3% de las originaciones de hipotecas totales.
| Segmento de clientes | Cuota de mercado | Volumen de transacción anual |
|---|---|---|
| Grandes prestamistas de hipotecas | 51.3% | $ 1.2 billones |
| Bancos regionales | 22.7% | $ 532 mil millones |
| Uniones de crédito locales | 15.5% | $ 363 mil millones |
Sensibilidad al precio en el mercado de seguros de títulos
La prima de seguro de título promedio en 2023 fue de $ 1,374, con variaciones de precios que varían entre $ 1,200 y $ 1,600 dependiendo de la ubicación geográfica y el valor de la propiedad.
Opciones de proveedor de seguros de título
- First American Financial Corporation (FAF)
- Fidelity National Financial
- Seguro de título nacional de la antigua república
- Compañía de garantía de título de Stewart
Poder de negociación institucional del cliente
Los grandes clientes institucionales pueden negociar descuentos de volumen de hasta 15-20% de descuento en tarifas de primas estándar. Los 10 principales prestamistas hipotecarios reciben las estructuras de precios más favorables.
| Tipo de cliente | Rango de descuento potencial | Valor de transacción anual |
|---|---|---|
| Los 10 principales prestamistas de hipotecas | 15-20% | $ 780 mil millones |
| Bancos regionales | 8-12% | $ 532 mil millones |
| Uniones de crédito locales | 3-7% | $ 363 mil millones |
First American Financial Corporation (FAF) - Las cinco fuerzas de Porter: rivalidad competitiva
Panorama competitivo del mercado
A partir de 2024, la industria de seguros de títulos demuestra una intensidad competitiva significativa con los siguientes actores clave:
| Compañía | Cuota de mercado | Ingresos (2023) |
|---|---|---|
| Fidelity National Financial | 35.7% | $ 8.2 mil millones |
| First American Financial Corporation | 27.4% | $ 6.5 mil millones |
| Servicios de información de Stewart | 15.3% | $ 3.1 mil millones |
| Otros competidores regionales | 21.6% | $ 4.7 mil millones |
Dinámica competitiva
El mercado de seguros de título exhibe características competitivas concentradas:
- Las 3 empresas principales controlan el 78.4% de la participación total en el mercado
- Los márgenes promedio de ganancias de la industria oscilan entre 15 y 18%
- Actividad anual de fusión y adquisición valorada en aproximadamente $ 750 millones
Métricas de competencia de precios
| Factor competitivo | Promedio de la industria |
|---|---|
| Tarifas de prima de seguro de título | $ 3.50 por valor de propiedad de $ 1,000 |
| Costo promedio de adquisición de clientes | $ 275- $ 425 por nuevo cliente |
First American Financial Corporation (FAF) - Las cinco fuerzas de Porter: amenaza de sustitutos
Métodos alternativos de gestión de riesgos en transacciones inmobiliarias
First American Financial Corporation enfrenta la competencia de enfoques alternativos de gestión de riesgos:
| Método de gestión de riesgos | Penetración del mercado | Costo promedio |
|---|---|---|
| Servicios de custodia | 17.3% | $1,250 |
| Programas de garantía de propiedad | 12.6% | $450-$600 |
| Búsquedas de propiedades legales | 8.9% | $350-$750 |
Plataformas digitales en crecimiento que ofrecen servicios de soporte de transacciones
Plataformas digitales que presentan riesgos de sustitución:
- Zillow ofrece: ingresos de $ 2.1 mil millones en 2022
- Redfin Direct: 1.5% de participación de mercado
- Opendoor: volumen de transacciones de $ 8.2 mil millones en 2022
Tecnologías emergentes de blockchain y verificación digital
| Tecnología | Inversión | Tasa de adopción |
|---|---|---|
| Plataformas de blockchain inmobiliarias | $ 743 millones | 6.2% |
| Sistemas de verificación de propiedades digitales | $ 412 millones | 4.7% |
Sustitutos directos limitados para un seguro de título integral
Panorama del mercado:
- Título Tamaño del mercado de seguros: $ 21.3 mil millones en 2023
- Primera participación en el mercado financiero estadounidense: 26.4%
- Premio de seguro de título promedio: $ 1,374
First American Financial Corporation (FAF) - Las cinco fuerzas de Porter: amenaza de nuevos participantes
Altos requisitos de cumplimiento regulatorio en el seguro de título
First American Financial Corporation enfrenta importantes barreras regulatorias. La industria de seguros de títulos requiere un patrimonio neto mínimo de $ 1.2 millones para la licencia estatal. Los departamentos de seguros estatales exigen $ 500,000 a $ 750,000 en reservas de capital iniciales.
| Requisito regulatorio | Umbral financiero |
|---|---|
| Patrimonio neto mínimo | $ 1.2 millones |
| Reservas de capital iniciales | $500,000 - $750,000 |
Inversión de capital inicial significativa
La entrada al mercado requiere recursos financieros sustanciales. Los costos estimados de inicio para una compañía de seguros de título oscilan entre $ 3.5 millones y $ 5.2 millones.
| Categoría de inversión | Rango de costos |
|---|---|
| Costos de inicio totales | $ 3.5 millones - $ 5.2 millones |
REPUTACIÓN Y RED establecida de la marca
La posición de mercado de First American Financial Corporation crea importantes barreras de entrada. La compañía posee una participación de mercado del 26.4% en la industria de seguros de títulos.
Infraestructura de tecnología avanzada
Los requisitos de inversión tecnológica son sustanciales. Título La infraestructura de tecnología de seguros cuesta aproximadamente $ 1.8 millones para la configuración inicial.
| Inversión tecnológica | Cantidad |
|---|---|
| Infraestructura de tecnología inicial | $ 1.8 millones |
Paisaje legal y regulatorio complejo
- 50 marcos regulatorios específicos del estado
- Costo de cumplimiento promedio: $ 425,000 anualmente
- Los requisitos de procesamiento de documentación legal superan las 3.000 páginas
First American Financial Corporation (FAF) - Porter's Five Forces: Competitive rivalry
You're looking at the title insurance space, and honestly, the rivalry among the top players is fierce because the market is so consolidated. This isn't a fragmented industry; it's a tight race among the Big Four, which definitely keeps the pressure on First American Financial Corporation (FAF).
The concentration is clear when you look at the market share based on title insurance premiums written in the first quarter of 2025. First American Title Insurance Co. held the top spot, but the top five players collectively commanded a massive share of the premium volume.
| Competitor Entity | Q1 2025 Title Premium Market Share |
|---|---|
| First American Title Insurance Co. | 22.9% |
| Fidelity National Title Insurance Co. | 14.1% |
| Old Republic National Title Insurance Co. | 14.0% |
| Chicago Title Insurance Co. | 12.9% |
| Stewart Title Guaranty Co. | 9.2% |
This concentration means every transaction matters. While the requested trailing 12-month revenue for First American Financial Corporation as of September 30, 2025, was not found, we can see the scale of the competition based on recent quarterly results. For the third quarter ending September 30, 2025, First American Financial Corporation reported total revenue of $2.0 billion, with title insurance and services segment revenue at $1.836 billion. Compare that to Fidelity National Financial (FNF), which posted Q3 2025 revenue of $4.03 billion. Old Republic International Corporation reported consolidated net premiums and fees earned of $2.1 billion for the same quarter, and Stewart Information Services Corporation reported total operating revenues of approximately $776.5 million. For the full year 2024, First American Financial Corporation's total revenue was $6.1 billion.
Competition definitely centers on operational excellence and technological lead. You see this play out in the metrics of transaction processing. For First American Financial Corporation in Q3 2025, the number of direct title orders closed in domestic operations increased by 17% year-over-year, but this was partially offset by a 3% decline in the average revenue per order closed. The domestic average revenue per order closed for that quarter was $3,801, a 3.2% decrease compared to the same period last year.
The fight for transaction volume is fueled by the high fixed costs inherent in this business. Think about the investment required for title plants, proprietary data assets, and digital closing platforms. Competitors must push volume to spread these costs effectively. This dynamic forces aggressive pricing or superior service delivery.
The current environment, shaped by interest rate volatility, makes the competition for shrinking order volume fierce when rates rise, but the recent environment has been more favorable. Falling mortgage rates in the third quarter of 2025 provided a boost for the Big Four, as First American Financial Corporation saw its title insurance revenue jump 42% year-over-year in Q3 2025.
- The overall title insurance industry revenue is estimated to reach $17.1 billion in 2025.
- Old Republic National Title Insurance Co.'s Title Insurance pretax operating income was $45.7 million in Q3 2025, up from $40.2 million a year ago.
- Fidelity National Financial (FNF) reported its Title Segment revenue increased by 8% to $2.3 billion in Q3 2025.
- First American Financial Corporation's Title Insurance and Services segment reported a pretax margin of 12.9% in Q3 2025.
First American Financial Corporation (FAF) - Porter's Five Forces: Threat of substitutes
Attorney Opinion Letters (AOLs) are a lower-cost alternative in some markets.
- Borrowers using an Attorney Opinion Letter (AOL) instead of title insurance saved over $1,000 in closing costs in Fannie Mae's system.
- The cost of an AOL is negotiated between the attorney and the recipient.
- AOLs reflect an attorney's judgment on property rights based on visible defects in public records.
The following table compares the characteristics of the substitute product versus traditional title insurance for lenders:
| Feature | Attorney Opinion Letter (AOL) | Lender's Title Insurance Policy |
| Primary Protection Basis | Attorney's judgment on visible defects | Insurance backing against undiscoverable risks |
| Cost to Borrower (Example) | Savings over $1,000 in closing costs | Generally more expensive |
| Coverage for Forgery/Fraud | No explicit coverage | Covered under policies like the First American Eagle Policy® |
| Regulation/Standardization | Format and content may widely differ | Strictly regulated by bodies like the Texas Department of Insurance (TDI) |
Potential government-sponsored enterprise (GSE) title waiver programs threaten lender's policies.
- A GSE title waiver pilot program allows certain refinance loans with loan-to-value ratios less than 80% to forgo lender's title policy or AOL.
- The White House claimed the pilot could save homeowners up to $1,000 or more in closing costs.
- The pilot involves an automated title review process to assess risk, with lenders paying a fee to the enterprise to cover risk if the automated review indicates low risk.
- The scale of the title waiver pilot is described as modest.
- In 2022, the title industry paid almost $600 million in claims, which opponents suggest could increase if the waiver program misses defects.
Blockchain technology adoption could eventually streamline title transfer, bypassing traditional insurance.
- The blockchain in insurance market size is projected to reach $3.08 billion in 2025.
- This market is expected to grow at a Compound Annual Growth Rate (CAGR) of 58.7% from 2024 to 2025.
- Blockchain-based tokenization platforms processed over $600 billion of real-world assets, including real estate, by 2025.
- Smart contracts could enable up to 50% savings on legal and operational costs for institutions in 2025.
- By 2025, over 80% of Fortune 500 companies had adopted blockchain technology in some capacity.
The low loss ratio (3% to 7%) suggests a high-cost, administrative service ripe for disruption.
- First American Financial Corporation's Title Insurance and Services segment reported an ultimate loss rate of 3.75 percent for the current policy year in the first quarter ended March 31, 2025.
- The ultimate loss rate remained 3.75 percent for the current policy year in the second quarter ended June 30, 2025.
- The ultimate loss rate was also 3.75 percent for the current policy year in the third quarter ended September 30, 2025.
- The provision for policy losses and other claims was stable at 3.0 percent of title premiums and escrow fees in the second quarter ended June 30, 2025.
- The provision for policy losses and other claims was 3.0 percent of title premiums and escrow fees in the third quarter ended September 30, 2025.
First American Financial Corporation (FAF) - Porter's Five Forces: Threat of new entrants
You're looking at the barriers to entry in the title insurance space, and honestly, they are formidable for any new player trying to challenge First American Financial Corporation. This industry is not set up for easy entry; it's a fortress built on regulation, capital, and historical data.
High Regulatory Barriers and Capital Requirements
The first wall a potential entrant hits is the regulatory maze. Title insurance is state-regulated, which means a new company can't just launch nationally; they have to navigate 50 different sets of rules. This involves complex rate filings that demand significant legal and actuarial resources just to get permission to operate.
Beyond the paperwork, there are substantial capital requirements to underwrite title insurance risk. For a Supervised Insurance Organization (SIO) like First American Financial Corporation, the Federal Reserve's Building Block Approach (BBA) dictates stringent capital levels. Claim reserves related to title insurance business are risk-weighted at a hefty 300%. The overall minimum requirement, including the buffer, can reach 400 percent of the building block capital requirement. This forces new entrants to raise and hold massive amounts of conservative capital before writing a single policy.
Here are some key regulatory and financial hurdles:
- Title insurance is regulated at the state level.
- Claim reserves are risk-weighted at 300% under the BBA.
- Minimum capital requirement plus buffer can equate to 400 percent.
- First American Financial Corporation's Q3 2025 debt-to-capital ratio was 33.0 percent.
The Proprietary Title Plant Barrier
The second massive barrier is the need for proprietary, historical title plant data. These title plants are the accumulated, indexed historical records-deeds, mortgages, liens-that allow for efficient title examination. Building this from scratch is a multi-decade, multi-million-dollar undertaking. You can't just buy this data off the shelf for a new operation; you need the depth and breadth First American Financial Corporation has cultivated for over a century.
To give you a sense of the scale of this data asset, competitors or data providers offer access to title plants that contain hundreds of millions of records. For example, one provider in Texas alone maintains over 450 million records across its title plants. Another major data source boasts a database with more than 8 billion land record images nationally. A new entrant would need to replicate this data infrastructure or pay exorbitant, recurring fees for third-party access, which often costs upwards of $500.00 per Month per County plus user and document fees. That's a huge, expensive moat.
Scale and Economies of Scale
First American Financial Corporation's sheer size translates directly into cost advantages that new entrants simply cannot match out of the gate. As of November 2025, First American Financial Corporation held a market capitalization of approximately $6.52 Billion USD. This scale allows them to spread fixed costs-like technology development for digital settlement products or compliance infrastructure-over a much larger revenue base. Their Q3 2025 total revenue was $2.0 billion. A new, small entrant has to absorb those same fixed costs on a fraction of that revenue, making their per-transaction cost structure immediately less competitive.
When you look at the competitive landscape, you see established players with significant market value, reinforcing the difficulty of breaking in:
| Company | Market Capitalization (Approx. Nov 2025) | Market Cap Difference from FAF |
|---|---|---|
| First American Financial Corporation (FAF) | $6.52 Billion USD | N/A |
| Old Republic International (ORI) | $10.97 B | +$4.45 Billion |
| Stewart Information Services (STC) | $2.04 B | -$4.48 Billion |
| Investors Title Company (ITIC) | $0.52 B | -$6.00 Billion |
The market values of competitors clearly show that First American Financial Corporation operates within a tier of established, well-capitalized entities. It's tough to compete when the incumbent's scale provides such a structural cost advantage. Finance: draft 13-week cash view by Friday.
Disclaimer
All information, articles, and product details provided on this website are for general informational and educational purposes only. We do not claim any ownership over, nor do we intend to infringe upon, any trademarks, copyrights, logos, brand names, or other intellectual property mentioned or depicted on this site. Such intellectual property remains the property of its respective owners, and any references here are made solely for identification or informational purposes, without implying any affiliation, endorsement, or partnership.
We make no representations or warranties, express or implied, regarding the accuracy, completeness, or suitability of any content or products presented. Nothing on this website should be construed as legal, tax, investment, financial, medical, or other professional advice. In addition, no part of this site—including articles or product references—constitutes a solicitation, recommendation, endorsement, advertisement, or offer to buy or sell any securities, franchises, or other financial instruments, particularly in jurisdictions where such activity would be unlawful.
All content is of a general nature and may not address the specific circumstances of any individual or entity. It is not a substitute for professional advice or services. Any actions you take based on the information provided here are strictly at your own risk. You accept full responsibility for any decisions or outcomes arising from your use of this website and agree to release us from any liability in connection with your use of, or reliance upon, the content or products found herein.