
|
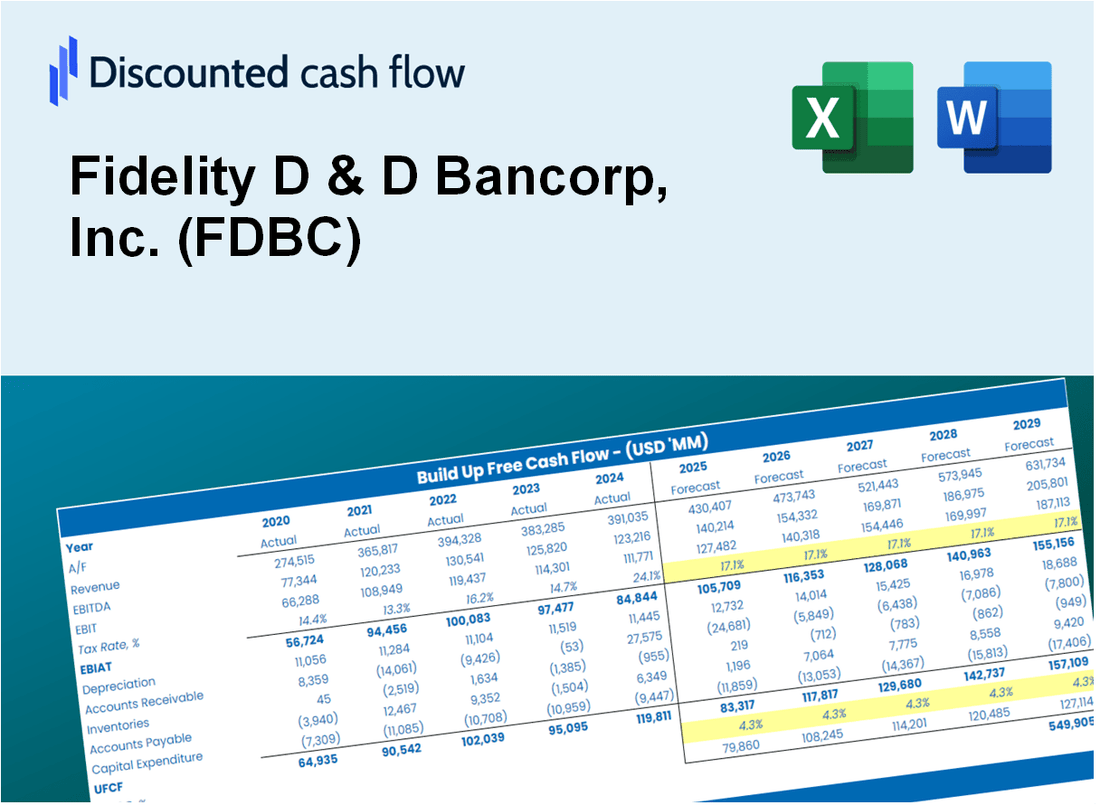
Valoración DCF de Fidelity D & D Bancorp, Inc. (FDBC) |
Completamente Editable: Adáptelo A Sus Necesidades En Excel O Sheets
Diseño Profesional: Plantillas Confiables Y Estándares De La Industria
Predeterminadas Para Un Uso Rápido Y Eficiente
Compatible con MAC / PC, completamente desbloqueado
No Se Necesita Experiencia; Fáciles De Seguir
Fidelity D & D Bancorp, Inc. (FDBC) Bundle
Descubre el verdadero valor de la fidelidad D & ¡D Bancorp, Inc. (FDBC) con nuestra calculadora DCF experta! Ajustar suposiciones esenciales, explorar varios escenarios y examinar cómo los diferentes factores afectan la valoración de la fidelidad D & D Bancorp, Inc. (FDBC): todo dentro de una conveniente plantilla de Excel.
What You Will Receive
- Comprehensive Financial Model: Fidelity D & D Bancorp, Inc.’s (FDBC) actual data allows for accurate DCF valuation.
- Complete Forecast Flexibility: Modify revenue growth, profit margins, WACC, and other essential variables.
- Real-Time Calculations: Automatic updates provide immediate insights as you adjust parameters.
- Professional-Grade Template: A polished Excel file crafted for high-quality financial valuation.
- Adaptable and Repeatable: Designed for versatility, enabling consistent use for in-depth forecasts.
Key Features
- Customizable Financial Metrics: Adjust essential inputs such as loan growth, net interest margin, and operating expenses.
- Instant DCF Valuation: Quickly computes intrinsic value, NPV, and additional financial metrics.
- High-Precision Accuracy: Leverages Fidelity D & D Bancorp's (FDBC) actual financial data for dependable valuation results.
- Streamlined Scenario Analysis: Effortlessly evaluate various assumptions and analyze the results.
- Efficiency Boost: Avoid the hassle of constructing intricate valuation models from the ground up.
How It Works
- Step 1: Download the Excel file.
- Step 2: Review pre-entered Fidelity D & D Bancorp, Inc. (FDBC) data (historical and projected).
- Step 3: Adjust key assumptions (yellow cells) based on your analysis.
- Step 4: View automatic recalculations for Fidelity D & D Bancorp, Inc. (FDBC)’s intrinsic value.
- Step 5: Use the outputs for investment decisions or reporting.
Why Choose This Calculator for Fidelity D & D Bancorp, Inc. (FDBC)?
- Accuracy: Utilizes real Fidelity D & D Bancorp financial data for precise calculations.
- Flexibility: Allows users to easily adjust and experiment with various inputs.
- Time-Saving: Eliminate the need to create a DCF model from the ground up.
- Professional-Grade: Crafted with the expertise and attention to detail expected at the CFO level.
- User-Friendly: Intuitive interface suitable for users with all levels of financial modeling skills.
Who Should Use This Product?
- Investors: Assess Fidelity D & D Bancorp, Inc.'s (FDBC) performance before making investment decisions.
- CFOs and Financial Analysts: Optimize valuation methodologies and evaluate financial forecasts for FDBC.
- Startup Founders: Understand the valuation metrics used for established banks like Fidelity D & D Bancorp, Inc. (FDBC).
- Consultants: Provide comprehensive valuation analyses and reports for clients interested in FDBC.
- Students and Educators: Utilize FDBC's financial data to enhance learning and practice valuation skills.
What the Template Contains
- Preloaded FDBC Data: Historical and projected financial data, including revenue, EBIT, and capital expenditures.
- DCF and WACC Models: Professional-grade sheets for calculating intrinsic value and Weighted Average Cost of Capital.
- Editable Inputs: Yellow-highlighted cells for adjusting revenue growth, tax rates, and discount rates.
- Financial Statements: Comprehensive annual and quarterly financials for deeper analysis.
- Key Ratios: Profitability, leverage, and efficiency ratios to evaluate performance.
- Dashboard and Charts: Visual summaries of valuation outcomes and assumptions.
Disclaimer
All information, articles, and product details provided on this website are for general informational and educational purposes only. We do not claim any ownership over, nor do we intend to infringe upon, any trademarks, copyrights, logos, brand names, or other intellectual property mentioned or depicted on this site. Such intellectual property remains the property of its respective owners, and any references here are made solely for identification or informational purposes, without implying any affiliation, endorsement, or partnership.
We make no representations or warranties, express or implied, regarding the accuracy, completeness, or suitability of any content or products presented. Nothing on this website should be construed as legal, tax, investment, financial, medical, or other professional advice. In addition, no part of this site—including articles or product references—constitutes a solicitation, recommendation, endorsement, advertisement, or offer to buy or sell any securities, franchises, or other financial instruments, particularly in jurisdictions where such activity would be unlawful.
All content is of a general nature and may not address the specific circumstances of any individual or entity. It is not a substitute for professional advice or services. Any actions you take based on the information provided here are strictly at your own risk. You accept full responsibility for any decisions or outcomes arising from your use of this website and agree to release us from any liability in connection with your use of, or reliance upon, the content or products found herein.