
|
Valoración de DCF de Finolex Cables Limited (fincables.ns) |
Completamente Editable: Adáptelo A Sus Necesidades En Excel O Sheets
Diseño Profesional: Plantillas Confiables Y Estándares De La Industria
Predeterminadas Para Un Uso Rápido Y Eficiente
Compatible con MAC / PC, completamente desbloqueado
No Se Necesita Experiencia; Fáciles De Seguir
Finolex Cables Limited (FINCABLES.NS) Bundle
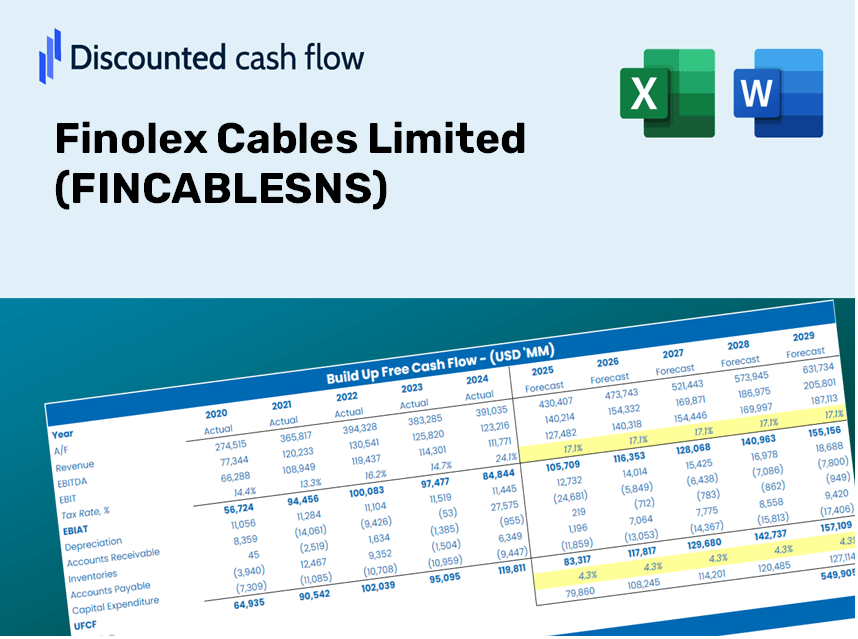
Diseñada para la precisión, nuestra calculadora DCF (FinCablesns) le permite evaluar la valoración de Finolex Cables Limited utilizando datos financieros del mundo real, ofreciendo una flexibilidad completa para modificar todos los parámetros clave para las proyecciones mejoradas.
Discounted Cash Flow (DCF) - (USD MM)
| Year | AY1 2021 |
AY2 2022 |
AY3 2023 |
AY4 2024 |
AY5 2025 |
FY1 2026 |
FY2 2027 |
FY3 2028 |
FY4 2029 |
FY5 2030 |
|---|---|---|---|---|---|---|---|---|---|---|
| Revenue | 27,681.1 | 37,681.4 | 44,811.1 | 50,143.9 | 53,188.9 | 62,898.7 | 74,381.0 | 87,959.4 | 104,016.6 | 123,005.1 |
| Revenue Growth, % | 0 | 36.13 | 18.92 | 11.9 | 6.07 | 18.26 | 18.26 | 18.26 | 18.26 | 18.26 |
| EBITDA | 3,801.0 | 4,237.1 | 5,020.7 | 5,838.5 | 5,347.4 | 7,280.8 | 8,609.9 | 10,181.7 | 12,040.4 | 14,238.4 |
| EBITDA, % | 13.73 | 11.24 | 11.2 | 11.64 | 10.05 | 11.58 | 11.58 | 11.58 | 11.58 | 11.58 |
| Depreciation | 371.5 | 370.7 | 391.0 | 394.9 | 415.6 | 599.7 | 709.2 | 838.7 | 991.8 | 1,172.8 |
| Depreciation, % | 1.34 | 0.98377 | 0.87255 | 0.78753 | 0.78137 | 0.95346 | 0.95346 | 0.95346 | 0.95346 | 0.95346 |
| EBIT | 3,429.5 | 3,866.4 | 4,629.7 | 5,443.6 | 4,931.8 | 6,681.1 | 7,900.7 | 9,343.0 | 11,048.6 | 13,065.6 |
| EBIT, % | 12.39 | 10.26 | 10.33 | 10.86 | 9.27 | 10.62 | 10.62 | 10.62 | 10.62 | 10.62 |
| Total Cash | 12,595.8 | 17,825.1 | 21,554.3 | 26,776.9 | 27,829.9 | 31,025.6 | 36,689.3 | 43,387.1 | 51,307.5 | 60,673.8 |
| Total Cash, percent | .0 | .0 | .0 | .0 | .0 | .0 | .0 | .0 | .0 | .0 |
| Account Receivables | 538.8 | 2,321.7 | 2,642.3 | 2,264.0 | 2,425.6 | 2,903.4 | 3,433.4 | 4,060.2 | 4,801.4 | 5,677.8 |
| Account Receivables, % | 1.95 | 6.16 | 5.9 | 4.52 | 4.56 | 4.62 | 4.62 | 4.62 | 4.62 | 4.62 |
| Inventories | 7,554.0 | 6,531.1 | 6,746.2 | 5,763.3 | 7,170.3 | 10,648.9 | 12,592.8 | 14,891.7 | 17,610.2 | 20,825.0 |
| Inventories, % | 27.29 | 17.33 | 15.05 | 11.49 | 13.48 | 16.93 | 16.93 | 16.93 | 16.93 | 16.93 |
| Accounts Payable | 1,496.8 | 1,607.5 | 1,795.8 | 2,342.1 | 2,417.2 | 2,880.3 | 3,406.1 | 4,027.9 | 4,763.2 | 5,632.7 |
| Accounts Payable, % | 5.41 | 4.27 | 4.01 | 4.67 | 4.54 | 4.58 | 4.58 | 4.58 | 4.58 | 4.58 |
| Capital Expenditure | -549.1 | -670.6 | -310.2 | -2,186.3 | -2,364.3 | -1,668.2 | -1,972.7 | -2,332.8 | -2,758.7 | -3,262.3 |
| Capital Expenditure, % | -1.98 | -1.78 | -0.69224 | -4.36 | -4.45 | -2.65 | -2.65 | -2.65 | -2.65 | -2.65 |
| Tax Rate, % | 24.03 | 24.03 | 24.03 | 24.03 | 24.03 | 24.03 | 24.03 | 24.03 | 24.03 | 24.03 |
| EBITAT | 2,508.6 | 2,944.9 | 3,594.8 | 4,106.9 | 3,746.6 | 5,055.9 | 5,978.8 | 7,070.3 | 8,361.0 | 9,887.3 |
| Depreciation | ||||||||||
| Changes in Account Receivables | ||||||||||
| Changes in Inventories | ||||||||||
| Changes in Accounts Payable | ||||||||||
| Capital Expenditure | ||||||||||
| UFCF | -4,265.0 | 1,995.7 | 3,328.2 | 4,223.0 | 304.4 | 494.2 | 2,767.2 | 3,272.3 | 3,869.7 | 4,576.1 |
| WACC, % | 4.7 | 4.7 | 4.7 | 4.7 | 4.7 | 4.7 | 4.7 | 4.7 | 4.7 | 4.7 |
| PV UFCF | ||||||||||
| SUM PV UFCF | 12,704.0 | |||||||||
| Long Term Growth Rate, % | 4.00 | |||||||||
| Free cash flow (T + 1) | 4,759 | |||||||||
| Terminal Value | 678,032 | |||||||||
| Present Terminal Value | 538,861 | |||||||||
| Enterprise Value | 551,565 | |||||||||
| Net Debt | -701 | |||||||||
| Equity Value | 552,267 | |||||||||
| Diluted Shares Outstanding, MM | 153 | |||||||||
| Equity Value Per Share | 3,611.03 |
What You Will Receive
- Flexible Forecast Parameters: Easily adjust key inputs (growth %, margins, WACC) to explore various scenarios.
- Comprehensive Market Data: Finolex Cables Limited’s financial data pre-loaded to facilitate your analysis.
- Instant DCF Calculations: The template automatically computes Net Present Value (NPV) and intrinsic value for you.
- Tailored and Professional Design: A refined Excel model that can be customized to meet your valuation requirements.
- Designed for Analysts and Investors: Perfect for evaluating projections, verifying strategies, and enhancing efficiency.
Key Features
- Authentic Financial Data: Gain access to reliable pre-loaded historical figures and future forecasts for Finolex Cables Limited (FINCABLESNS).
- Tailorable Forecast Inputs: Modify the yellow-highlighted cells, including WACC, growth rates, and profit margins.
- Real-Time Calculations: Enjoy automatic updates for DCF, Net Present Value (NPV), and cash flow assessments.
- Intuitive Visual Dashboard: User-friendly charts and summaries to effectively illustrate your valuation outcomes.
- Designed for All Levels: A straightforward and intuitive layout catering to investors, CFOs, and consultants alike.
How It Works
- Step 1: Download the prebuilt Excel template featuring Finolex Cables Limited (FINCABLESNS) data.
- Step 2: Navigate through the pre-filled sheets to familiarize yourself with the key metrics.
- Step 3: Adjust forecasts and assumptions in the editable yellow cells (WACC, growth, margins).
- Step 4: Instantly view recalculated results, including the intrinsic value of Finolex Cables Limited (FINCABLESNS).
- Step 5: Make informed investment decisions or create reports based on the generated outputs.
Why Choose Finolex Cables Limited (FINCABLESNS)?
- Time-Efficient: Skip the complexities of market analysis – our insights are ready for immediate use.
- Enhanced Accuracy: Dependable financial information and methodologies minimize valuation errors.
- Completely Customizable: Adjust the parameters to align with your specific assumptions and forecasts.
- User-Friendly: Intuitive charts and outputs simplify the interpretation of results.
- Endorsed by Professionals: Crafted for experts who prioritize accuracy and functionality.
Who Should Utilize This Product?
- Individual Investors: Make educated choices regarding the purchase or sale of Finolex Cables Limited (FINCABLESNS) stock.
- Financial Analysts: Enhance valuation workflows with easily accessible financial models.
- Consultants: Provide clients with accurate and timely valuation insights for Finolex Cables Limited (FINCABLESNS).
- Business Owners: Gain insights into the valuation methods of large firms like Finolex Cables Limited (FINCABLESNS) to inform your own business strategy.
- Finance Students: Explore valuation methodologies using real-world data related to Finolex Cables Limited (FINCABLESNS).
Contents of the Template
- Historical Data: Contains Finolex Cables Limited’s past financial performance and baseline forecasts.
- DCF and Levered DCF Models: Comprehensive templates for calculating the intrinsic value of Finolex Cables Limited (FINCABLESNS).
- WACC Sheet: Pre-configured calculations for the Weighted Average Cost of Capital.
- Editable Inputs: Adjust key parameters such as growth rates, EBITDA %, and CAPEX assumptions.
- Quarterly and Annual Statements: A thorough breakdown of Finolex Cables Limited’s financials.
- Interactive Dashboard: Visualize valuation results and forecasts in real time.
Disclaimer
All information, articles, and product details provided on this website are for general informational and educational purposes only. We do not claim any ownership over, nor do we intend to infringe upon, any trademarks, copyrights, logos, brand names, or other intellectual property mentioned or depicted on this site. Such intellectual property remains the property of its respective owners, and any references here are made solely for identification or informational purposes, without implying any affiliation, endorsement, or partnership.
We make no representations or warranties, express or implied, regarding the accuracy, completeness, or suitability of any content or products presented. Nothing on this website should be construed as legal, tax, investment, financial, medical, or other professional advice. In addition, no part of this site—including articles or product references—constitutes a solicitation, recommendation, endorsement, advertisement, or offer to buy or sell any securities, franchises, or other financial instruments, particularly in jurisdictions where such activity would be unlawful.
All content is of a general nature and may not address the specific circumstances of any individual or entity. It is not a substitute for professional advice or services. Any actions you take based on the information provided here are strictly at your own risk. You accept full responsibility for any decisions or outcomes arising from your use of this website and agree to release us from any liability in connection with your use of, or reliance upon, the content or products found herein.