
|
Valoración de DCF de Fluxys Belgium SA (Flux.Br) |
Completamente Editable: Adáptelo A Sus Necesidades En Excel O Sheets
Diseño Profesional: Plantillas Confiables Y Estándares De La Industria
Predeterminadas Para Un Uso Rápido Y Eficiente
Compatible con MAC / PC, completamente desbloqueado
No Se Necesita Experiencia; Fáciles De Seguir
Fluxys Belgium SA (FLUX.BR) Bundle
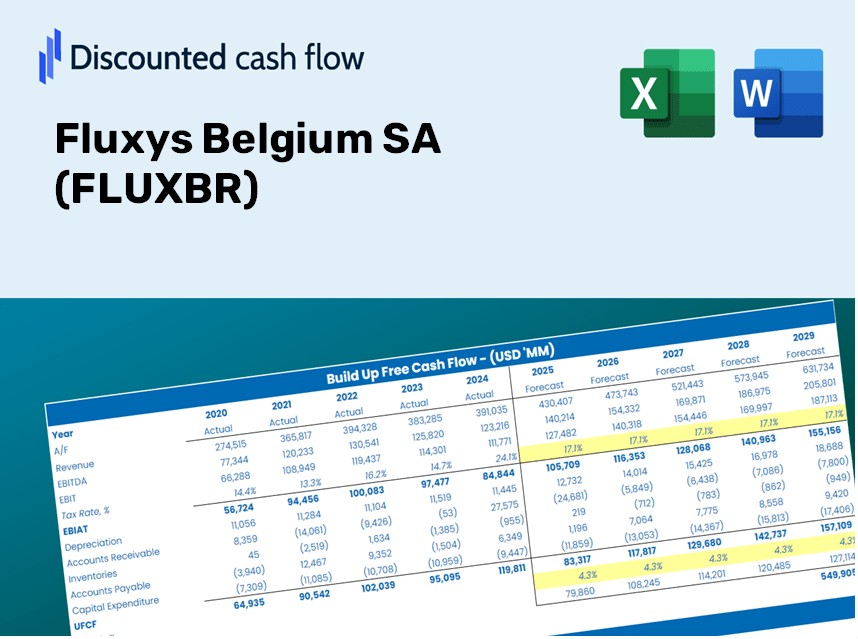
Ingementada para su precisión, nuestra calculadora DCF (fluxBR) le permite evaluar la valoración de Fluxys Belgium SA utilizando datos financieros del mundo real, proporcionando una flexibilidad completa para modificar todos los parámetros esenciales para mejorar las proyecciones.
Discounted Cash Flow (DCF) - (USD MM)
| Year | AY1 2020 |
AY2 2021 |
AY3 2022 |
AY4 2023 |
AY5 2024 |
FY1 2025 |
FY2 2026 |
FY3 2027 |
FY4 2028 |
FY5 2029 |
|---|---|---|---|---|---|---|---|---|---|---|
| Revenue | 587.5 | 605.6 | 1,191.1 | 753.5 | 667.7 | 628.0 | 590.6 | 555.4 | 522.3 | 491.2 |
| Revenue Growth, % | 0 | 3.08 | 96.7 | -36.74 | -11.39 | -5.95 | -5.95 | -5.95 | -5.95 | -5.95 |
| EBITDA | 308.0 | 311.8 | 315.4 | 331.8 | 356.0 | 286.0 | 269.0 | 253.0 | 237.9 | 223.7 |
| EBITDA, % | 52.43 | 51.49 | 26.48 | 44.03 | 53.31 | 45.55 | 45.55 | 45.55 | 45.55 | 45.55 |
| Depreciation | 174.5 | 174.0 | 168.1 | 166.9 | 177.5 | 152.3 | 143.3 | 134.7 | 126.7 | 119.2 |
| Depreciation, % | 29.71 | 28.73 | 14.11 | 22.15 | 26.59 | 24.26 | 24.26 | 24.26 | 24.26 | 24.26 |
| EBIT | 133.5 | 137.8 | 147.3 | 164.9 | 178.4 | 133.7 | 125.7 | 118.2 | 111.2 | 104.6 |
| EBIT, % | 22.72 | 22.76 | 12.37 | 21.88 | 26.72 | 21.29 | 21.29 | 21.29 | 21.29 | 21.29 |
| Total Cash | 416.8 | 412.7 | 1,096.8 | 1,101.2 | 1,123.2 | 541.5 | 509.3 | 479.0 | 450.4 | 423.6 |
| Total Cash, percent | .0 | .0 | .0 | .0 | .0 | .0 | .0 | .0 | .0 | .0 |
| Account Receivables | 77.5 | 93.3 | 170.0 | 115.2 | 96.7 | 91.2 | 85.8 | 80.7 | 75.9 | 71.4 |
| Account Receivables, % | 13.19 | 15.4 | 14.28 | 15.29 | 14.48 | 14.53 | 14.53 | 14.53 | 14.53 | 14.53 |
| Inventories | 26.4 | 39.0 | 62.7 | 50.4 | 52.7 | 38.7 | 36.4 | 34.2 | 32.2 | 30.2 |
| Inventories, % | 4.49 | 6.45 | 5.26 | 6.69 | 7.89 | 6.16 | 6.16 | 6.16 | 6.16 | 6.16 |
| Accounts Payable | 30.3 | 33.9 | 59.3 | 54.5 | 50.9 | 38.4 | 36.1 | 34.0 | 32.0 | 30.1 |
| Accounts Payable, % | 5.16 | 5.61 | 4.98 | 7.23 | 7.63 | 6.12 | 6.12 | 6.12 | 6.12 | 6.12 |
| Capital Expenditure | -47.3 | -56.5 | -116.9 | -184.8 | -103.9 | -84.5 | -79.5 | -74.7 | -70.3 | -66.1 |
| Capital Expenditure, % | -8.05 | -9.34 | -9.82 | -24.52 | -15.55 | -13.46 | -13.46 | -13.46 | -13.46 | -13.46 |
| Tax Rate, % | 22.97 | 22.97 | 22.97 | 22.97 | 22.97 | 22.97 | 22.97 | 22.97 | 22.97 | 22.97 |
| EBITAT | 104.4 | 103.6 | 112.3 | 132.1 | 137.5 | 103.4 | 97.3 | 91.5 | 86.0 | 80.9 |
| Depreciation | ||||||||||
| Changes in Account Receivables | ||||||||||
| Changes in Inventories | ||||||||||
| Changes in Accounts Payable | ||||||||||
| Capital Expenditure | ||||||||||
| UFCF | 158.1 | 196.2 | 88.5 | 176.4 | 223.8 | 178.3 | 166.5 | 156.6 | 147.2 | 138.5 |
| WACC, % | 5.28 | 5.19 | 5.22 | 5.34 | 5.24 | 5.25 | 5.25 | 5.25 | 5.25 | 5.25 |
| PV UFCF | ||||||||||
| SUM PV UFCF | 681.1 | |||||||||
| Long Term Growth Rate, % | 2.00 | |||||||||
| Free cash flow (T + 1) | 141 | |||||||||
| Terminal Value | 4,340 | |||||||||
| Present Terminal Value | 3,360 | |||||||||
| Enterprise Value | 4,041 | |||||||||
| Net Debt | -10 | |||||||||
| Equity Value | 4,051 | |||||||||
| Diluted Shares Outstanding, MM | 70 | |||||||||
| Equity Value Per Share | 57.65 |
What You Will Receive
- Pre-Configured Financial Model: Leveraging Fluxys Belgium SA's (FLUXBR) actual data for an accurate DCF valuation.
- Comprehensive Forecast Control: Easily modify revenue growth, profit margins, WACC, and other critical variables.
- Immediate Calculations: Real-time updates provide instant feedback as you make adjustments.
- Professional-Grade Template: A polished Excel file crafted for high-quality valuation needs.
- Flexible and Reusable: Designed for adaptability, enabling ongoing use for in-depth forecasting.
Key Features
- 🔍 Real-Life FLUXBR Financials: Pre-filled historical and projected data for Fluxys Belgium SA.
- ✏️ Fully Customizable Inputs: Modify essential parameters (yellow cells) such as WACC, growth %, and tax rates.
- 📊 Professional DCF Valuation: Integrated formulas compute Fluxys Belgium's intrinsic value using the Discounted Cash Flow approach.
- ⚡ Instant Results: Visualize Fluxys Belgium’s valuation immediately after adjusting inputs.
- Scenario Analysis: Evaluate and compare results for different financial assumptions side-by-side.
How It Works
- Step 1: Download the Excel file.
- Step 2: Review the pre-filled data for Fluxys Belgium SA (FLUXBR) including historical trends and future projections.
- Step 3: Modify key assumptions (highlighted in yellow) according to your insights.
- Step 4: Observe the automatic recalculations reflecting the intrinsic value of Fluxys Belgium SA (FLUXBR).
- Step 5: Utilize the results for your investment strategies or reporting purposes.
Why Opt for This Calculator for Fluxys Belgium SA (FLUXBR)?
- All-in-One Tool: Combines DCF, WACC, and comprehensive financial ratio analyses in a single platform.
- Flexible Inputs: Modify the yellow-highlighted cells to explore various scenarios tailored to Fluxys Belgium SA.
- In-Depth Analysis: Automatically computes the intrinsic value and Net Present Value for Fluxys Belgium SA (FLUXBR).
- Ready-to-Use Data: Comes with historical and projected data for precise initial assessments.
- Expert-Level Quality: Perfect for financial analysts, investors, and consultants focused on Fluxys Belgium SA.
Who Can Benefit from This Product?
- Finance Students: Discover valuation methodologies and apply them with real-world data.
- Academics: Integrate industry models into your teaching or research projects.
- Investors: Validate your investment hypotheses and assess valuation results for Fluxys Belgium SA (FLUXBR).
- Analysts: Enhance your efficiency with a pre-designed, adaptable DCF model.
- Small Business Owners: Understand the analytical approaches used for major public companies like Fluxys Belgium SA (FLUXBR).
Contents of the Template
- Pre-Filled Data: Contains historical financial information and forecasts for Fluxys Belgium SA (FLUXBR).
- Discounted Cash Flow Model: An editable DCF valuation model featuring automatic calculations.
- Weighted Average Cost of Capital (WACC): A dedicated worksheet for WACC calculations based on user-defined inputs.
- Key Financial Ratios: Evaluate Fluxys Belgium SA's profitability, efficiency, and financial leverage.
- Customizable Inputs: Easily modify revenue growth, profit margins, and tax rates.
- Clear Dashboard: Visual representations and tables that summarize essential valuation outcomes.
Disclaimer
All information, articles, and product details provided on this website are for general informational and educational purposes only. We do not claim any ownership over, nor do we intend to infringe upon, any trademarks, copyrights, logos, brand names, or other intellectual property mentioned or depicted on this site. Such intellectual property remains the property of its respective owners, and any references here are made solely for identification or informational purposes, without implying any affiliation, endorsement, or partnership.
We make no representations or warranties, express or implied, regarding the accuracy, completeness, or suitability of any content or products presented. Nothing on this website should be construed as legal, tax, investment, financial, medical, or other professional advice. In addition, no part of this site—including articles or product references—constitutes a solicitation, recommendation, endorsement, advertisement, or offer to buy or sell any securities, franchises, or other financial instruments, particularly in jurisdictions where such activity would be unlawful.
All content is of a general nature and may not address the specific circumstances of any individual or entity. It is not a substitute for professional advice or services. Any actions you take based on the information provided here are strictly at your own risk. You accept full responsibility for any decisions or outcomes arising from your use of this website and agree to release us from any liability in connection with your use of, or reliance upon, the content or products found herein.