
|
Valoración DCF de Flexsteel Industries, Inc. (FLXS) |
Completamente Editable: Adáptelo A Sus Necesidades En Excel O Sheets
Diseño Profesional: Plantillas Confiables Y Estándares De La Industria
Predeterminadas Para Un Uso Rápido Y Eficiente
Compatible con MAC / PC, completamente desbloqueado
No Se Necesita Experiencia; Fáciles De Seguir
Flexsteel Industries, Inc. (FLXS) Bundle
¡Evalúe las perspectivas financieras de FlexSteel Industries, Inc. como un experto! Esta calculadora DCF (FLXS) le proporciona finanzas preladas y ofrece una flexibilidad completa para modificar el crecimiento de los ingresos, WACC, los márgenes y otros supuestos esenciales para alinearse con sus predicciones.
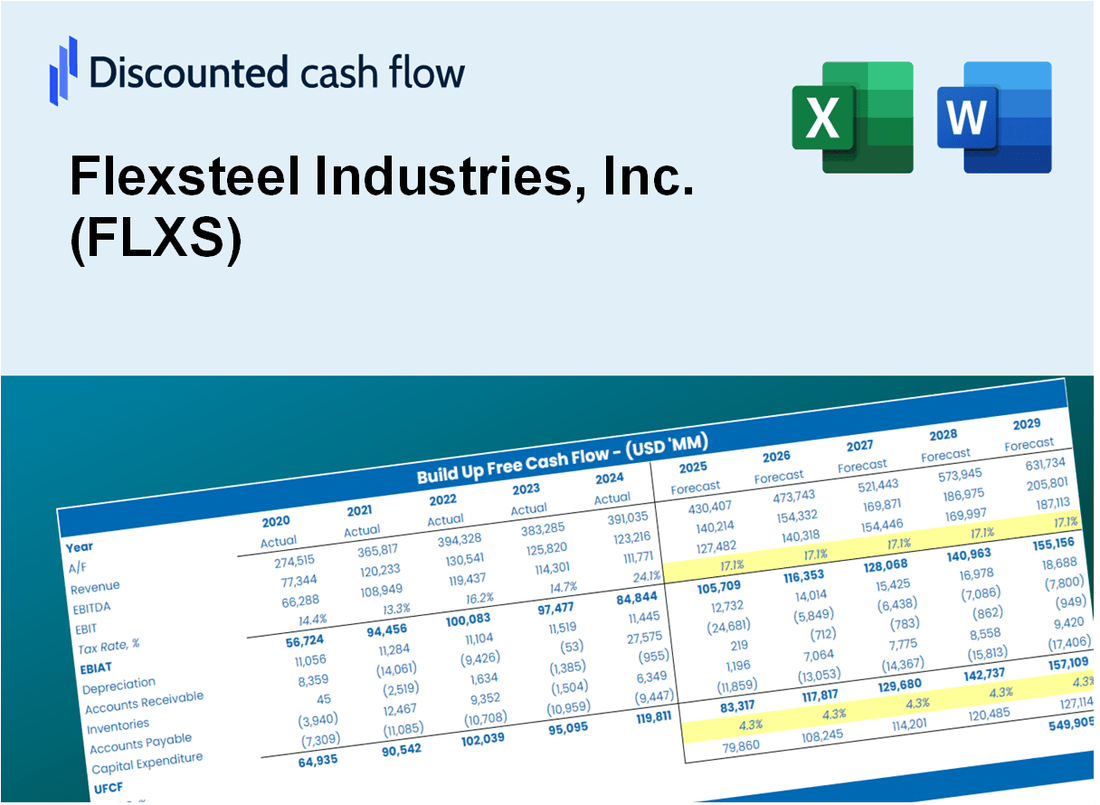
Discounted Cash Flow (DCF) - (USD MM)
| Year | AY1 2021 |
AY2 2022 |
AY3 2023 |
AY4 2024 |
AY5 2025 |
FY1 2026 |
FY2 2027 |
FY3 2028 |
FY4 2029 |
FY5 2030 |
|---|---|---|---|---|---|---|---|---|---|---|
| Revenue | 478.9 | 544.3 | 393.7 | 412.8 | 441.1 | 438.5 | 436.0 | 433.4 | 430.9 | 428.4 |
| Revenue Growth, % | 0 | 13.65 | -27.67 | 4.84 | 6.86 | -0.57955 | -0.57955 | -0.57955 | -0.57955 | -0.57955 |
| EBITDA | 36.7 | 11.9 | 15.1 | 21.1 | 30.7 | 22.6 | 22.5 | 22.3 | 22.2 | 22.1 |
| EBITDA, % | 7.66 | 2.19 | 3.84 | 5.11 | 6.96 | 5.15 | 5.15 | 5.15 | 5.15 | 5.15 |
| Depreciation | 5.2 | 5.2 | 4.6 | 4.0 | 3.7 | 4.4 | 4.4 | 4.3 | 4.3 | 4.3 |
| Depreciation, % | 1.09 | 0.95006 | 1.16 | 0.96838 | 0.82843 | 0.99921 | 0.99921 | 0.99921 | 0.99921 | 0.99921 |
| EBIT | 31.5 | 6.7 | 10.6 | 17.1 | 27.0 | 18.2 | 18.1 | 18.0 | 17.9 | 17.8 |
| EBIT, % | 6.57 | 1.24 | 2.68 | 4.14 | 6.13 | 4.15 | 4.15 | 4.15 | 4.15 | 4.15 |
| Total Cash | 1.3 | 2.2 | 3.4 | 4.8 | 40.0 | 10.3 | 10.3 | 10.2 | 10.1 | 10.1 |
| Total Cash, percent | .0 | .0 | .0 | .0 | .0 | .0 | .0 | .0 | .0 | .0 |
| Account Receivables | 56.0 | 41.1 | 38.2 | 44.2 | 35.2 | 41.8 | 41.5 | 41.3 | 41.1 | 40.8 |
| Account Receivables, % | 11.69 | 7.55 | 9.69 | 10.72 | 7.99 | 9.53 | 9.53 | 9.53 | 9.53 | 9.53 |
| Inventories | 161.1 | 141.2 | 122.1 | 96.6 | 89.1 | 117.7 | 117.0 | 116.3 | 115.7 | 115.0 |
| Inventories, % | 33.64 | 25.94 | 31.01 | 23.4 | 20.21 | 26.84 | 26.84 | 26.84 | 26.84 | 26.84 |
| Accounts Payable | 67.8 | 32.1 | 24.7 | 25.8 | 25.6 | 33.7 | 33.5 | 33.3 | 33.1 | 32.9 |
| Accounts Payable, % | 14.15 | 5.91 | 6.29 | 6.26 | 5.81 | 7.68 | 7.68 | 7.68 | 7.68 | 7.68 |
| Capital Expenditure | -2.6 | -3.9 | -4.8 | -4.8 | -3.3 | -3.8 | -3.8 | -3.8 | -3.8 | -3.7 |
| Capital Expenditure, % | -0.53871 | -0.70791 | -1.22 | -1.16 | -0.73865 | -0.87162 | -0.87162 | -0.87162 | -0.87162 | -0.87162 |
| Tax Rate, % | 25.26 | 25.26 | 25.26 | 25.26 | 25.26 | 25.26 | 25.26 | 25.26 | 25.26 | 25.26 |
| EBITAT | 23.1 | 2.1 | 16.9 | 11.6 | 20.2 | 12.6 | 12.6 | 12.5 | 12.4 | 12.4 |
| Depreciation | ||||||||||
| Changes in Account Receivables | ||||||||||
| Changes in Inventories | ||||||||||
| Changes in Accounts Payable | ||||||||||
| Capital Expenditure | ||||||||||
| UFCF | -123.7 | 2.6 | 31.4 | 31.3 | 36.8 | -13.8 | 13.9 | 13.8 | 13.7 | 13.6 |
| WACC, % | 5.63 | 5.28 | 5.86 | 5.58 | 5.64 | 5.6 | 5.6 | 5.6 | 5.6 | 5.6 |
| PV UFCF | ||||||||||
| SUM PV UFCF | 32.4 | |||||||||
| Long Term Growth Rate, % | 3.50 | |||||||||
| Free cash flow (T + 1) | 14 | |||||||||
| Terminal Value | 672 | |||||||||
| Present Terminal Value | 512 | |||||||||
| Enterprise Value | 544 | |||||||||
| Net Debt | 19 | |||||||||
| Equity Value | 525 | |||||||||
| Diluted Shares Outstanding, MM | 6 | |||||||||
| Equity Value Per Share | 92.39 |
What You Will Get
- Real Flexsteel Data: Preloaded financials – from revenue to EBIT – based on actual and projected figures.
- Full Customization: Adjust all critical parameters (yellow cells) like WACC, growth %, and tax rates.
- Instant Valuation Updates: Automatic recalculations to analyze the impact of changes on Flexsteel's fair value.
- Versatile Excel Template: Tailored for quick edits, scenario testing, and detailed projections.
- Time-Saving and Accurate: Skip building models from scratch while maintaining precision and flexibility.
Key Features
- 🔍 Real-Life FLXS Financials: Pre-filled historical and projected data for Flexsteel Industries, Inc.
- ✏️ Fully Customizable Inputs: Adjust all critical parameters (yellow cells) like WACC, growth %, and tax rates.
- 📊 Professional DCF Valuation: Built-in formulas calculate Flexsteel’s intrinsic value using the Discounted Cash Flow method.
- ⚡ Instant Results: Visualize Flexsteel’s valuation instantly after making changes.
- Scenario Analysis: Test and compare outcomes for various financial assumptions side-by-side.
How It Works
- Download: Obtain the ready-to-use Excel file featuring Flexsteel Industries, Inc.'s (FLXS) financial data.
- Customize: Modify forecasts, including revenue growth, EBITDA %, and WACC.
- Update Automatically: The intrinsic value and NPV calculations refresh in real-time.
- Test Scenarios: Generate various projections and compare results instantly.
- Make Decisions: Leverage the valuation outcomes to inform your investment strategy.
Why Choose This Calculator for Flexsteel Industries, Inc. (FLXS)?
- User-Friendly Interface: Tailored for both novices and seasoned professionals.
- Customizable Inputs: Easily adjust parameters to suit your financial analysis.
- Real-Time Insights: Witness immediate updates to Flexsteel's valuation as you modify inputs.
- Preloaded Data: Comes equipped with Flexsteel's actual financial metrics for swift evaluations.
- Relied Upon by Experts: Favored by investors and analysts for making well-informed choices.
Who Should Use Flexsteel Industries, Inc. (FLXS) Products?
- Interior Designers: Create stunning spaces with high-quality furniture solutions.
- Retailers: Enhance your showroom with a diverse range of stylish and durable products.
- Contractors: Easily source reliable furnishings for commercial projects.
- Homeowners: Transform your living spaces with elegant and comfortable options.
- Students and Educators: Explore design principles and furniture manufacturing in academic settings.
What the Template Contains
- Pre-Filled Data: Includes Flexsteel Industries' historical financials and forecasts.
- Discounted Cash Flow Model: Editable DCF valuation model with automatic calculations.
- Weighted Average Cost of Capital (WACC): A dedicated sheet for calculating WACC based on custom inputs.
- Key Financial Ratios: Analyze Flexsteel's profitability, efficiency, and leverage.
- Customizable Inputs: Edit revenue growth, margins, and tax rates with ease.
- Clear Dashboard: Charts and tables summarizing key valuation results.
Disclaimer
All information, articles, and product details provided on this website are for general informational and educational purposes only. We do not claim any ownership over, nor do we intend to infringe upon, any trademarks, copyrights, logos, brand names, or other intellectual property mentioned or depicted on this site. Such intellectual property remains the property of its respective owners, and any references here are made solely for identification or informational purposes, without implying any affiliation, endorsement, or partnership.
We make no representations or warranties, express or implied, regarding the accuracy, completeness, or suitability of any content or products presented. Nothing on this website should be construed as legal, tax, investment, financial, medical, or other professional advice. In addition, no part of this site—including articles or product references—constitutes a solicitation, recommendation, endorsement, advertisement, or offer to buy or sell any securities, franchises, or other financial instruments, particularly in jurisdictions where such activity would be unlawful.
All content is of a general nature and may not address the specific circumstances of any individual or entity. It is not a substitute for professional advice or services. Any actions you take based on the information provided here are strictly at your own risk. You accept full responsibility for any decisions or outcomes arising from your use of this website and agree to release us from any liability in connection with your use of, or reliance upon, the content or products found herein.