
|
Valoración de DCF FNAC Darty SA (FNAC.PA) |
Completamente Editable: Adáptelo A Sus Necesidades En Excel O Sheets
Diseño Profesional: Plantillas Confiables Y Estándares De La Industria
Predeterminadas Para Un Uso Rápido Y Eficiente
Compatible con MAC / PC, completamente desbloqueado
No Se Necesita Experiencia; Fáciles De Seguir
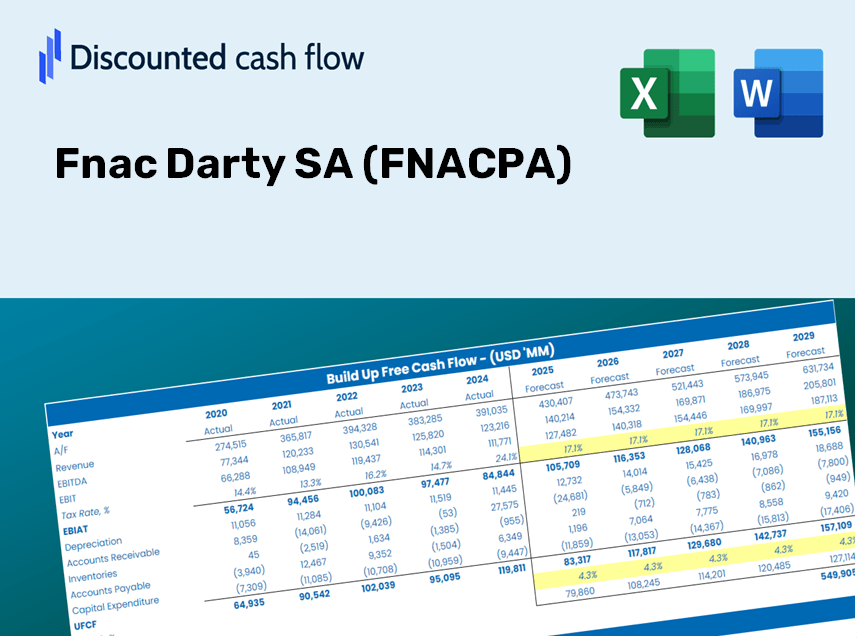
Fnac Darty SA (FNAC.PA) Bundle
¡Agilice su análisis y mejore la precisión con nuestra calculadora DCF (FNACPA)! Esta herramienta utiliza datos reales de FNAC Darty SA y le permite personalizar supuestos, lo que le permite pronosticar, analizar y valorar FNAC Darty SA como un inversor experto.
Discounted Cash Flow (DCF) - (USD MM)
| Year | AY1 2020 |
AY2 2021 |
AY3 2022 |
AY4 2023 |
AY5 2024 |
FY1 2025 |
FY2 2026 |
FY3 2027 |
FY4 2028 |
FY5 2029 |
|---|---|---|---|---|---|---|---|---|---|---|
| Revenue | 7,490.7 | 8,042.6 | 7,949.4 | 7,874.7 | 8,253.2 | 8,461.1 | 8,674.2 | 8,892.7 | 9,116.7 | 9,346.4 |
| Revenue Growth, % | 0 | 7.37 | -1.16 | -0.93969 | 4.81 | 2.52 | 2.52 | 2.52 | 2.52 | 2.52 |
| EBITDA | 199.4 | 610.7 | 552.7 | 22.9 | 679.3 | 435.4 | 446.4 | 457.6 | 469.1 | 481.0 |
| EBITDA, % | 2.66 | 7.59 | 6.95 | 0.2908 | 8.23 | 5.15 | 5.15 | 5.15 | 5.15 | 5.15 |
| Depreciation | .0 | 350.1 | 349.3 | 3.5 | 524.8 | 256.4 | 262.8 | 269.5 | 276.2 | 283.2 |
| Depreciation, % | 0 | 4.35 | 4.39 | 0.04444614 | 6.36 | 3.03 | 3.03 | 3.03 | 3.03 | 3.03 |
| EBIT | 199.4 | 260.6 | 203.4 | 19.4 | 154.5 | 179.0 | 183.5 | 188.2 | 192.9 | 197.8 |
| EBIT, % | 2.66 | 3.24 | 2.56 | 0.24636 | 1.87 | 2.12 | 2.12 | 2.12 | 2.12 | 2.12 |
| Total Cash | 1,568.7 | 1,190.5 | 950.8 | 1,143.7 | 1,091.6 | 1,276.9 | 1,309.0 | 1,342.0 | 1,375.8 | 1,410.5 |
| Total Cash, percent | .0 | .0 | .0 | .0 | .0 | .0 | .0 | .0 | .0 | .0 |
| Account Receivables | 289.0 | 305.3 | 255.1 | 188.7 | 245.9 | 274.8 | 281.7 | 288.8 | 296.1 | 303.6 |
| Account Receivables, % | 3.86 | 3.8 | 3.21 | 2.4 | 2.98 | 3.25 | 3.25 | 3.25 | 3.25 | 3.25 |
| Inventories | 960.2 | 1,104.3 | 1,143.7 | 1,157.6 | 1,658.9 | 1,281.6 | 1,313.9 | 1,347.0 | 1,380.9 | 1,415.7 |
| Inventories, % | 12.82 | 13.73 | 14.39 | 14.7 | 20.1 | 15.15 | 15.15 | 15.15 | 15.15 | 15.15 |
| Accounts Payable | 1,784.4 | 2,036.9 | 1,965.1 | 2,152.7 | 2,657.8 | 2,257.6 | 2,314.4 | 2,372.7 | 2,432.5 | 2,493.8 |
| Accounts Payable, % | 23.82 | 25.33 | 24.72 | 27.34 | 32.2 | 26.68 | 26.68 | 26.68 | 26.68 | 26.68 |
| Capital Expenditure | -108.0 | -116.8 | -138.4 | -139.2 | -123.9 | -133.8 | -137.1 | -140.6 | -144.1 | -147.7 |
| Capital Expenditure, % | -1.44 | -1.45 | -1.74 | -1.77 | -1.5 | -1.58 | -1.58 | -1.58 | -1.58 | -1.58 |
| Tax Rate, % | 50.14 | 50.14 | 50.14 | 50.14 | 50.14 | 50.14 | 50.14 | 50.14 | 50.14 | 50.14 |
| EBITAT | 1.6 | 190.9 | -41.2 | -25.0 | 77.0 | 44.4 | 45.5 | 46.6 | 47.8 | 49.0 |
| Depreciation | ||||||||||
| Changes in Account Receivables | ||||||||||
| Changes in Inventories | ||||||||||
| Changes in Accounts Payable | ||||||||||
| Capital Expenditure | ||||||||||
| UFCF | 428.8 | 516.3 | 108.7 | 79.4 | 424.5 | 115.1 | 188.9 | 193.6 | 198.5 | 203.5 |
| WACC, % | 2.68 | 4.65 | 2.66 | 2.66 | 4.01 | 3.33 | 3.33 | 3.33 | 3.33 | 3.33 |
| PV UFCF | ||||||||||
| SUM PV UFCF | 810.6 | |||||||||
| Long Term Growth Rate, % | 0.50 | |||||||||
| Free cash flow (T + 1) | 205 | |||||||||
| Terminal Value | 7,221 | |||||||||
| Present Terminal Value | 6,130 | |||||||||
| Enterprise Value | 6,940 | |||||||||
| Net Debt | 1,369 | |||||||||
| Equity Value | 5,571 | |||||||||
| Diluted Shares Outstanding, MM | 32 | |||||||||
| Equity Value Per Share | 173.04 |
What You Will Receive
- Authentic Fnac Darty Data: Preloaded financials – encompassing everything from revenue to EBIT – derived from actual and projected figures.
- Comprehensive Customization: Modify all key parameters (yellow cells) such as WACC, growth %, and tax rates.
- Real-Time Valuation Updates: Automatic recalculations to assess how changes affect Fnac Darty’s fair value.
- Flexible Excel Template: Designed for quick modifications, scenario analysis, and detailed projections.
- Efficient and Accurate: Bypass the need to build models from scratch while ensuring precision and adaptability.
Key Features
- Customizable Forecast Inputs: Adjust essential variables such as sales growth, operating margin, and investment expenditures.
- Instant DCF Valuation: Automatically computes intrinsic value, net present value, and additional metrics without delay.
- High-Precision Accuracy: Incorporates Fnac Darty SA's (FNACPA) actual financial data for realistic valuation results.
- Streamlined Scenario Analysis: Effortlessly evaluate various assumptions and analyze different scenarios.
- Efficiency Boost: Remove the hassle of developing intricate valuation models from the ground up.
How It Functions
- Step 1: Download the prebuilt Excel template featuring Fnac Darty SA’s (FNACPA) data.
- Step 2: Review the pre-filled sheets to familiarize yourself with the essential metrics.
- Step 3: Modify forecasts and assumptions in the editable yellow cells (WACC, growth, margins).
- Step 4: Instantly see the recalculated results, including Fnac Darty SA’s (FNACPA) intrinsic value.
- Step 5: Make well-informed investment decisions or create reports based on the generated outputs.
Why Opt for This Calculator?
- Precise Data: Utilizes authentic Fnac Darty financials for trustworthy valuation outcomes.
- Customizable: Tailor essential parameters such as growth rates, WACC, and tax rates to correspond with your forecasts.
- Time-Efficient: Built-in calculations save you from the hassle of starting from the ground up.
- Professional-Quality Tool: Crafted for investors, analysts, and consultants in the industry.
- User-Friendly: Easy-to-navigate layout and clear instructions facilitate usage for everyone.
Who Can Benefit from This Product?
- Investors: Precisely assess the fair value of Fnac Darty SA (FNACPA) prior to making investment choices.
- CFOs: Utilize a high-caliber DCF model for comprehensive financial reporting and analytics.
- Consultants: Efficiently customize the template for client valuation reports.
- Entrepreneurs: Acquire knowledge of financial modeling techniques used by leading corporations.
- Educators: Employ it as a resource to illustrate various valuation methods in the classroom.
What the Template Contains for Fnac Darty SA (FNACPA)
- Historical Data: Contains Fnac Darty's previous financial performance and baseline projections.
- DCF and Levered DCF Models: Comprehensive templates for assessing Fnac Darty's intrinsic value.
- WACC Sheet: Pre-configured calculations for Weighted Average Cost of Capital.
- Editable Inputs: Adjust essential factors such as growth rates, EBITDA %, and CAPEX assumptions.
- Quarterly and Annual Statements: An exhaustive breakdown of Fnac Darty's financial reports.
- Interactive Dashboard: Dynamically visualize valuation outcomes and future projections.
Disclaimer
All information, articles, and product details provided on this website are for general informational and educational purposes only. We do not claim any ownership over, nor do we intend to infringe upon, any trademarks, copyrights, logos, brand names, or other intellectual property mentioned or depicted on this site. Such intellectual property remains the property of its respective owners, and any references here are made solely for identification or informational purposes, without implying any affiliation, endorsement, or partnership.
We make no representations or warranties, express or implied, regarding the accuracy, completeness, or suitability of any content or products presented. Nothing on this website should be construed as legal, tax, investment, financial, medical, or other professional advice. In addition, no part of this site—including articles or product references—constitutes a solicitation, recommendation, endorsement, advertisement, or offer to buy or sell any securities, franchises, or other financial instruments, particularly in jurisdictions where such activity would be unlawful.
All content is of a general nature and may not address the specific circumstances of any individual or entity. It is not a substitute for professional advice or services. Any actions you take based on the information provided here are strictly at your own risk. You accept full responsibility for any decisions or outcomes arising from your use of this website and agree to release us from any liability in connection with your use of, or reliance upon, the content or products found herein.