
|
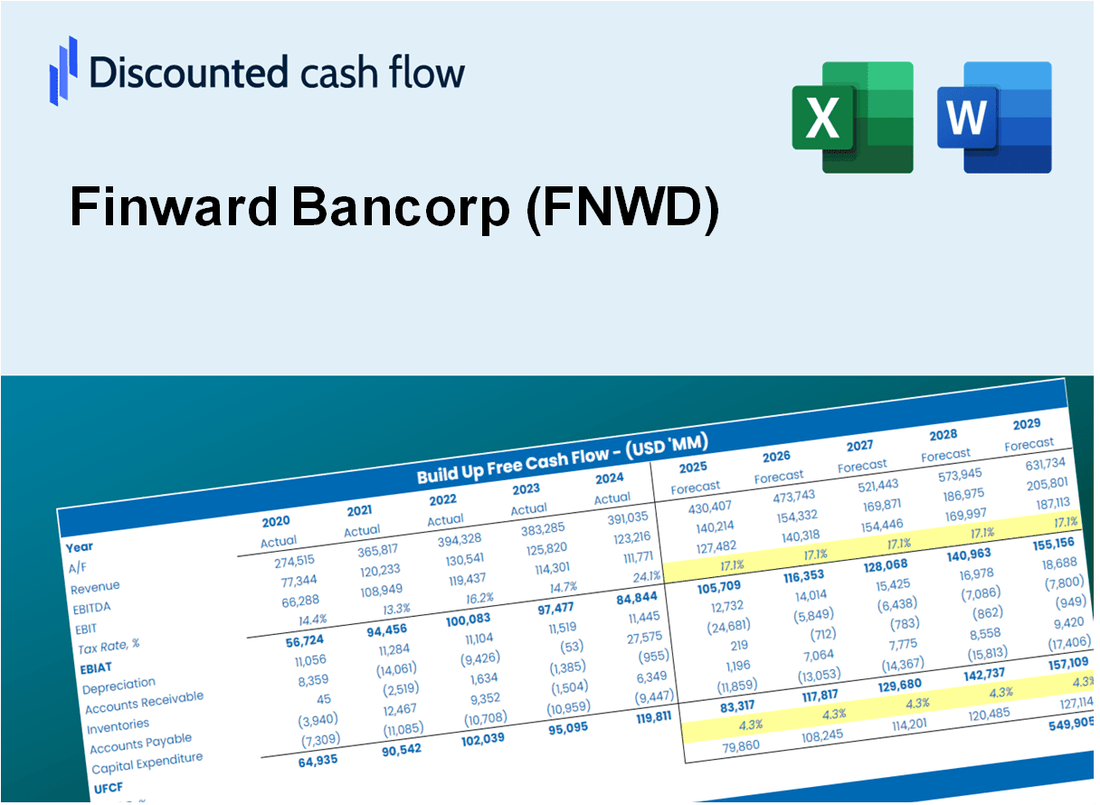
Valoración DCF de Finward Bancorp (FNWD) |
Completamente Editable: Adáptelo A Sus Necesidades En Excel O Sheets
Diseño Profesional: Plantillas Confiables Y Estándares De La Industria
Predeterminadas Para Un Uso Rápido Y Eficiente
Compatible con MAC / PC, completamente desbloqueado
No Se Necesita Experiencia; Fáciles De Seguir
Finward Bancorp (FNWD) Bundle
¡Mejore sus estrategias de inversión con la calculadora DCF de Finward Bancorp (FNWD)! Utilice datos financieros auténticos, ajuste las proyecciones y gastos de crecimiento, y observe instantáneamente cómo estas modificaciones afectan el valor intrínseco de Finward Bancorp (FNWD).
Discounted Cash Flow (DCF) - (USD MM)
| Year | AY1 2020 |
AY2 2021 |
AY3 2022 |
AY4 2023 |
AY5 2024 |
FY1 2025 |
FY2 2026 |
FY3 2027 |
FY4 2028 |
FY5 2029 |
|---|---|---|---|---|---|---|---|---|---|---|
| Revenue | 69.8 | 66.6 | 83.5 | 96.5 | 111.8 | 126.4 | 143.0 | 161.7 | 182.8 | 206.7 |
| Revenue Growth, % | 0 | -4.54 | 25.44 | 15.54 | 15.85 | 13.07 | 13.07 | 13.07 | 13.07 | 13.07 |
| EBITDA | 21.9 | 20.9 | 22.5 | 15.2 | 20.7 | 31.4 | 35.5 | 40.1 | 45.4 | 51.3 |
| EBITDA, % | 31.4 | 31.43 | 26.96 | 15.75 | 18.55 | 24.82 | 24.82 | 24.82 | 24.82 | 24.82 |
| Depreciation | 3.2 | 4.6 | 6.0 | 7.2 | 7.3 | 8.2 | 9.3 | 10.5 | 11.9 | 13.4 |
| Depreciation, % | 4.59 | 6.85 | 7.14 | 7.42 | 6.52 | 6.5 | 6.5 | 6.5 | 6.5 | 6.5 |
| EBIT | 18.7 | 16.4 | 16.6 | 8.0 | 13.5 | 23.2 | 26.2 | 29.6 | 33.5 | 37.9 |
| EBIT, % | 26.81 | 24.59 | 19.82 | 8.33 | 12.03 | 18.32 | 18.32 | 18.32 | 18.32 | 18.32 |
| Total Cash | 430.6 | 560.1 | 404.6 | 457.4 | 404.1 | 126.4 | 143.0 | 161.7 | 182.8 | 206.7 |
| Total Cash, percent | .0 | .0 | .0 | .0 | .0 | .0 | .0 | .0 | .0 | .0 |
| Account Receivables | 4.7 | 5.4 | 7.4 | 8.0 | 7.7 | 9.9 | 11.2 | 12.6 | 14.3 | 16.1 |
| Account Receivables, % | 6.76 | 8.17 | 8.88 | 8.33 | 6.9 | 7.81 | 7.81 | 7.81 | 7.81 | 7.81 |
| Inventories | .0 | .0 | .0 | .0 | .0 | .0 | .0 | .0 | .0 | .0 |
| Inventories, % | 0 | 0 | 0 | 0 | 0 | 0 | 0 | 0 | 0 | 0 |
| Accounts Payable | .0 | .0 | .0 | .0 | .0 | .0 | .0 | .0 | .0 | .0 |
| Accounts Payable, % | 0 | 0 | 0 | 0 | 0 | 0 | 0 | 0 | 0 | 0 |
| Capital Expenditure | -3.7 | -3.1 | -3.0 | -1.1 | -3.1 | -4.5 | -5.0 | -5.7 | -6.4 | -7.3 |
| Capital Expenditure, % | -5.35 | -4.7 | -3.63 | -1.19 | -2.75 | -3.52 | -3.52 | -3.52 | -3.52 | -3.52 |
| Tax Rate, % | 9.85 | 9.85 | 9.85 | 9.85 | 9.85 | 9.85 | 9.85 | 9.85 | 9.85 | 9.85 |
| EBITAT | 15.9 | 15.0 | 15.1 | 8.4 | 12.1 | 21.2 | 24.0 | 27.1 | 30.7 | 34.7 |
| Depreciation | ||||||||||
| Changes in Account Receivables | ||||||||||
| Changes in Inventories | ||||||||||
| Changes in Accounts Payable | ||||||||||
| Capital Expenditure | ||||||||||
| UFCF | 10.7 | 15.7 | 16.0 | 13.8 | 16.7 | 22.8 | 26.9 | 30.5 | 34.5 | 39.0 |
| WACC, % | 16.68 | 17.67 | 17.62 | 19.05 | 17.48 | 17.7 | 17.7 | 17.7 | 17.7 | 17.7 |
| PV UFCF | ||||||||||
| SUM PV UFCF | 92.7 | |||||||||
| Long Term Growth Rate, % | 2.00 | |||||||||
| Free cash flow (T + 1) | 40 | |||||||||
| Terminal Value | 253 | |||||||||
| Present Terminal Value | 112 | |||||||||
| Enterprise Value | 205 | |||||||||
| Net Debt | 35 | |||||||||
| Equity Value | 170 | |||||||||
| Diluted Shares Outstanding, MM | 4 | |||||||||
| Equity Value Per Share | 39.71 |
What You Will Get
- Editable Forecast Inputs: Seamlessly modify assumptions (growth %, margins, WACC) to explore various scenarios.
- Real-World Data: Finward Bancorp’s (FNWD) financial data pre-loaded to facilitate your analysis.
- Automatic DCF Outputs: The template computes Net Present Value (NPV) and intrinsic value automatically.
- Customizable and Professional: A refined Excel model that adjusts to your valuation requirements.
- Built for Analysts and Investors: Perfect for evaluating projections, confirming strategies, and enhancing efficiency.
Key Features
- 🔍 Real-Life FNWD Financials: Pre-filled historical and projected data for Finward Bancorp (FNWD).
- ✏️ Fully Customizable Inputs: Adjust all critical parameters (yellow cells) like WACC, growth %, and tax rates.
- 📊 Professional DCF Valuation: Built-in formulas calculate Finward Bancorp’s intrinsic value using the Discounted Cash Flow method.
- ⚡ Instant Results: Visualize Finward Bancorp’s valuation instantly after making changes.
- Scenario Analysis: Test and compare outcomes for various financial assumptions side-by-side.
How It Works
- 1. Access the Template: Download and open the Excel file containing Finward Bancorp’s (FNWD) preloaded data.
- 2. Modify Assumptions: Adjust key parameters such as growth rates, WACC, and capital expenditures.
- 3. View Results in Real-Time: The DCF model automatically calculates intrinsic value and NPV based on your inputs.
- 4. Explore Scenarios: Analyze various forecasts to evaluate different valuation results.
- 5. Present with Assurance: Deliver professional valuation insights to bolster your decision-making process.
Why Choose This Calculator for Finward Bancorp (FNWD)?
- Accurate Data: Up-to-date Finward Bancorp financials provide dependable valuation outcomes.
- Customizable: Tailor essential parameters such as growth rates, WACC, and tax rates to align with your forecasts.
- Time-Saving: Ready-made calculations save you from starting from ground zero.
- Professional-Grade Tool: Created for investors, analysts, and financial consultants.
- User-Friendly: Simple layout and guided instructions ensure accessibility for all users.
Who Should Use This Product?
- Investors: Accurately assess Finward Bancorp’s (FNWD) fair value prior to making investment choices.
- CFOs: Utilize a professional-grade DCF model for comprehensive financial reporting and analysis.
- Consultants: Efficiently customize the template for valuation reports tailored to clients.
- Entrepreneurs: Acquire insights into financial modeling practices employed by leading banks.
- Educators: Implement it as a teaching resource to illustrate valuation techniques.
What the Template Contains
- Historical Data: Contains Finward Bancorp’s past financials and baseline forecasts.
- DCF and Levered DCF Models: Comprehensive templates to calculate Finward Bancorp’s intrinsic value.
- WACC Sheet: Pre-configured calculations for Weighted Average Cost of Capital.
- Editable Inputs: Adjust key drivers such as growth rates, EBITDA %, and CAPEX assumptions.
- Quarterly and Annual Statements: A thorough breakdown of Finward Bancorp’s financials.
- Interactive Dashboard: Dynamically visualize valuation results and projections.
Disclaimer
All information, articles, and product details provided on this website are for general informational and educational purposes only. We do not claim any ownership over, nor do we intend to infringe upon, any trademarks, copyrights, logos, brand names, or other intellectual property mentioned or depicted on this site. Such intellectual property remains the property of its respective owners, and any references here are made solely for identification or informational purposes, without implying any affiliation, endorsement, or partnership.
We make no representations or warranties, express or implied, regarding the accuracy, completeness, or suitability of any content or products presented. Nothing on this website should be construed as legal, tax, investment, financial, medical, or other professional advice. In addition, no part of this site—including articles or product references—constitutes a solicitation, recommendation, endorsement, advertisement, or offer to buy or sell any securities, franchises, or other financial instruments, particularly in jurisdictions where such activity would be unlawful.
All content is of a general nature and may not address the specific circumstances of any individual or entity. It is not a substitute for professional advice or services. Any actions you take based on the information provided here are strictly at your own risk. You accept full responsibility for any decisions or outcomes arising from your use of this website and agree to release us from any liability in connection with your use of, or reliance upon, the content or products found herein.