
|
Fresnillo plc (Fres.L) Valoración de DCF |
Completamente Editable: Adáptelo A Sus Necesidades En Excel O Sheets
Diseño Profesional: Plantillas Confiables Y Estándares De La Industria
Predeterminadas Para Un Uso Rápido Y Eficiente
Compatible con MAC / PC, completamente desbloqueado
No Se Necesita Experiencia; Fáciles De Seguir
Fresnillo plc (FRES.L) Bundle
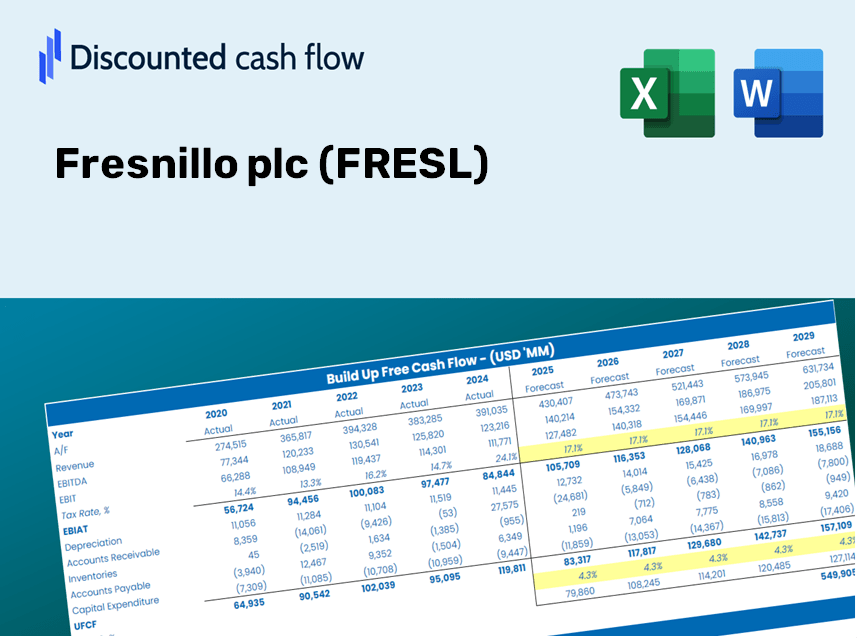
¡Obtenga dominio sobre su análisis de valoración de Fresnillo PLC (FRESL) utilizando nuestra calculadora DCF de última generación! Con datos reales (FRESL) precargados, esta plantilla de Excel le permite ajustar preventos y supuestos, lo que permite cálculos precisos del valor intrínseco de Fresnillo PLC.
Discounted Cash Flow (DCF) - (USD MM)
| Year | AY1 2020 |
AY2 2021 |
AY3 2022 |
AY4 2023 |
AY5 2024 |
FY1 2025 |
FY2 2026 |
FY3 2027 |
FY4 2028 |
FY5 2029 |
|---|---|---|---|---|---|---|---|---|---|---|
| Revenue | 1,848.4 | 2,056.1 | 1,850.6 | 2,057.6 | 2,659.5 | 2,936.6 | 3,242.6 | 3,580.4 | 3,953.5 | 4,365.5 |
| Revenue Growth, % | 0 | 11.24 | -9.99 | 11.18 | 29.25 | 10.42 | 10.42 | 10.42 | 10.42 | 10.42 |
| EBITDA | 951.0 | 914.2 | 630.7 | 530.2 | 1,025.7 | 1,141.3 | 1,260.3 | 1,391.6 | 1,536.6 | 1,696.7 |
| EBITDA, % | 51.45 | 44.46 | 34.08 | 25.77 | 38.57 | 38.87 | 38.87 | 38.87 | 38.87 | 38.87 |
| Depreciation | 392.4 | 402.7 | 381.7 | 379.2 | 468.2 | 572.5 | 632.1 | 698.0 | 770.7 | 851.0 |
| Depreciation, % | 21.23 | 19.58 | 20.62 | 18.43 | 17.61 | 19.49 | 19.49 | 19.49 | 19.49 | 19.49 |
| EBIT | 558.5 | 511.5 | 249.1 | 151.0 | 557.5 | 568.9 | 628.1 | 693.6 | 765.9 | 845.7 |
| EBIT, % | 30.22 | 24.88 | 13.46 | 7.34 | 20.96 | 19.37 | 19.37 | 19.37 | 19.37 | 19.37 |
| Total Cash | 814.2 | 939.6 | 737.1 | 406.6 | 987.2 | 1,095.1 | 1,209.2 | 1,335.2 | 1,474.3 | 1,628.0 |
| Total Cash, percent | .0 | .0 | .0 | .0 | .0 | .0 | .0 | .0 | .0 | .0 |
| Account Receivables | 285.4 | 226.7 | 242.3 | 248.5 | 444.8 | 401.5 | 443.3 | 489.5 | 540.5 | 596.8 |
| Account Receivables, % | 15.44 | 11.02 | 13.09 | 12.08 | 16.72 | 13.67 | 13.67 | 13.67 | 13.67 | 13.67 |
| Inventories | 267.4 | 301.4 | 377.1 | 352.2 | 313.7 | 460.5 | 508.5 | 561.5 | 620.0 | 684.6 |
| Inventories, % | 14.47 | 14.66 | 20.38 | 17.11 | 11.8 | 15.68 | 15.68 | 15.68 | 15.68 | 15.68 |
| Accounts Payable | 66.1 | 99.0 | 106.7 | 89.8 | 84.3 | 127.4 | 140.7 | 155.3 | 171.5 | 189.4 |
| Accounts Payable, % | 3.57 | 4.82 | 5.77 | 4.37 | 3.17 | 4.34 | 4.34 | 4.34 | 4.34 | 4.34 |
| Capital Expenditure | -313.6 | -450.3 | -450.4 | -367.7 | -281.8 | -538.4 | -594.5 | -656.5 | -724.9 | -800.4 |
| Capital Expenditure, % | -16.97 | -21.9 | -24.34 | -17.87 | -10.6 | -18.34 | -18.34 | -18.34 | -18.34 | -18.34 |
| Tax Rate, % | 81.06 | 81.06 | 81.06 | 81.06 | 81.06 | 81.06 | 81.06 | 81.06 | 81.06 | 81.06 |
| EBITAT | 379.1 | 352.3 | 272.4 | 309.8 | 105.6 | 404.7 | 446.8 | 493.4 | 544.8 | 601.6 |
| Depreciation | ||||||||||
| Changes in Account Receivables | ||||||||||
| Changes in Inventories | ||||||||||
| Changes in Accounts Payable | ||||||||||
| Capital Expenditure | ||||||||||
| UFCF | -28.9 | 362.5 | 120.0 | 323.2 | 128.6 | 378.3 | 407.9 | 450.4 | 497.3 | 549.1 |
| WACC, % | 6.09 | 6.09 | 6.19 | 6.19 | 5.95 | 6.1 | 6.1 | 6.1 | 6.1 | 6.1 |
| PV UFCF | ||||||||||
| SUM PV UFCF | 1,896.7 | |||||||||
| Long Term Growth Rate, % | 3.50 | |||||||||
| Free cash flow (T + 1) | 568 | |||||||||
| Terminal Value | 21,852 | |||||||||
| Present Terminal Value | 16,252 | |||||||||
| Enterprise Value | 18,149 | |||||||||
| Net Debt | -195 | |||||||||
| Equity Value | 18,344 | |||||||||
| Diluted Shares Outstanding, MM | 737 | |||||||||
| Equity Value Per Share | 2,489.38 |
What You Will Receive
- Customizable Excel Template: An adaptable Excel-based DCF Calculator featuring pre-populated financial data for Fresnillo plc (FRESL).
- Accurate Market Data: Historical performance metrics and forward-looking estimates (highlighted in the yellow cells).
- Flexible Forecasting: Adjust forecast parameters such as revenue growth, EBITDA margins, and WACC.
- Instant Calculations: Quickly view how your inputs affect the valuation of Fresnillo plc (FRESL).
- Professional Resource: Designed for investors, CFOs, consultants, and financial analysts.
- User-Friendly Layout: Organized for ease of understanding and navigation, complete with comprehensive instructions.
Key Features of Fresnillo plc (FRESL)
- Customizable Financial Parameters: Adjust essential inputs such as production volume, operating costs, and future investment plans.
- Instant DCF Valuation: Quickly determines intrinsic value, net present value, and other financial metrics.
- High Precision Results: Leverages Fresnillo’s actual financial data for accurate valuation projections.
- Simplified Scenario Analysis: Evaluate various assumptions and analyze results with ease.
- Efficiency-Boosting Tool: Remove the hassle of constructing intricate valuation models from the ground up.
How It Functions
- Step 1: Download the Excel spreadsheet.
- Step 2: Examine the pre-filled data for Fresnillo plc (FRESL) (historical and forecasted).
- Step 3: Modify key assumptions (highlighted in yellow) based on your insights.
- Step 4: Observe the automatic updates for Fresnillo plc's (FRESL) intrinsic value.
- Step 5: Utilize the results for your investment strategies or reports.
Why Choose This Calculator for Fresnillo plc (FRESL)?
- Reliable Data: Utilize authentic Fresnillo financials for trustworthy valuation outcomes.
- Flexible Options: Modify essential parameters such as growth rates, WACC, and tax rates to align with your forecasts.
- Efficient: Built-in calculations save you the hassle of starting from the ground up.
- High-Quality Tool: Tailored for investors, analysts, and financial consultants.
- Easy to Use: User-friendly design and clear, step-by-step guidance make it accessible for everyone.
Who Should Use This Product?
- Professional Investors: Develop comprehensive and accurate valuation models for portfolio assessments of Fresnillo plc (FRESL).
- Corporate Finance Teams: Evaluate valuation scenarios to inform strategic decisions within the organization.
- Consultants and Advisors: Deliver precise valuation insights to clients regarding Fresnillo plc (FRESL) stock.
- Students and Educators: Utilize real-world data for practical learning and teaching in financial modeling.
- Mining Industry Enthusiasts: Gain a better understanding of how companies like Fresnillo plc (FRESL) are valued in the marketplace.
Contents of the Template
- Comprehensive DCF Model: Editable template featuring detailed valuation calculations.
- Real-World Data: Fresnillo plc's (FRESL) historical and projected financials preloaded for in-depth analysis.
- Customizable Parameters: Modify WACC, growth rates, and tax assumptions to explore different scenarios.
- Financial Statements: Complete annual and quarterly breakdowns for enhanced insights.
- Key Ratios: Integrated analysis for profitability, efficiency, and leverage metrics.
- Dashboard with Visual Outputs: Charts and tables designed for clear, actionable insights.
Disclaimer
All information, articles, and product details provided on this website are for general informational and educational purposes only. We do not claim any ownership over, nor do we intend to infringe upon, any trademarks, copyrights, logos, brand names, or other intellectual property mentioned or depicted on this site. Such intellectual property remains the property of its respective owners, and any references here are made solely for identification or informational purposes, without implying any affiliation, endorsement, or partnership.
We make no representations or warranties, express or implied, regarding the accuracy, completeness, or suitability of any content or products presented. Nothing on this website should be construed as legal, tax, investment, financial, medical, or other professional advice. In addition, no part of this site—including articles or product references—constitutes a solicitation, recommendation, endorsement, advertisement, or offer to buy or sell any securities, franchises, or other financial instruments, particularly in jurisdictions where such activity would be unlawful.
All content is of a general nature and may not address the specific circumstances of any individual or entity. It is not a substitute for professional advice or services. Any actions you take based on the information provided here are strictly at your own risk. You accept full responsibility for any decisions or outcomes arising from your use of this website and agree to release us from any liability in connection with your use of, or reliance upon, the content or products found herein.