
|
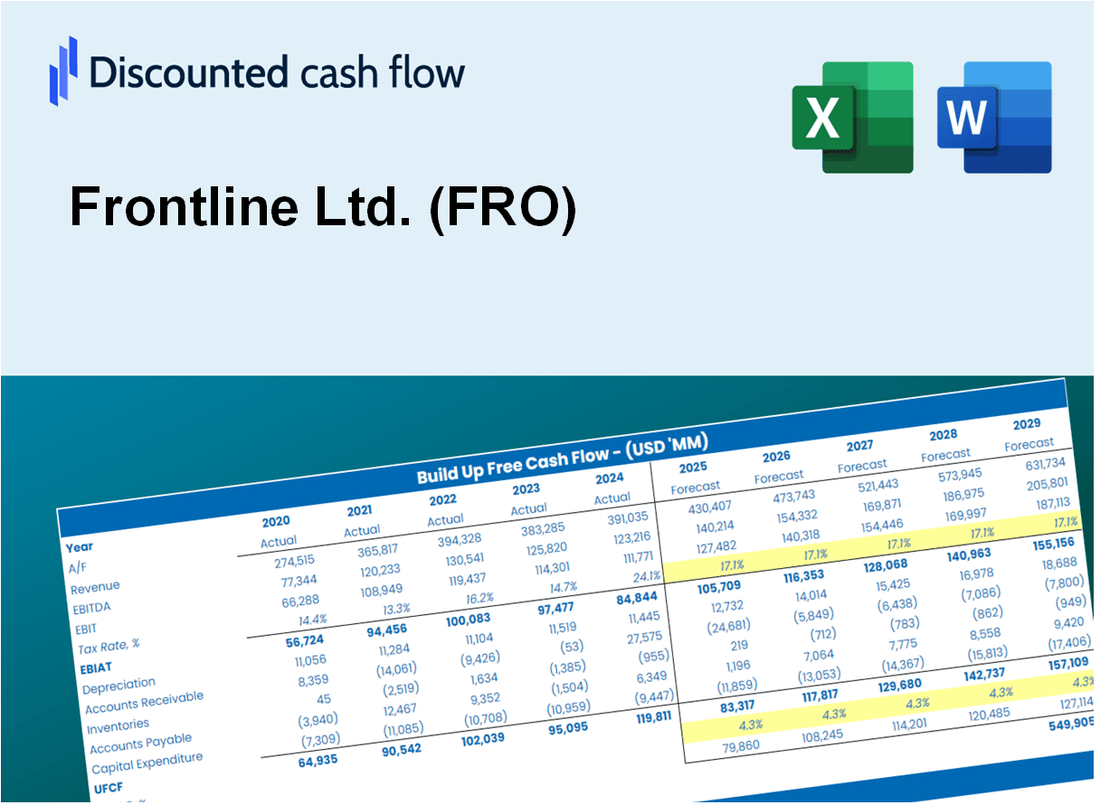
Valoración DCF de Frontline Ltd. (FRO) |
Completamente Editable: Adáptelo A Sus Necesidades En Excel O Sheets
Diseño Profesional: Plantillas Confiables Y Estándares De La Industria
Predeterminadas Para Un Uso Rápido Y Eficiente
Compatible con MAC / PC, completamente desbloqueado
No Se Necesita Experiencia; Fáciles De Seguir
Frontline Ltd. (FRO) Bundle
¿Busca determinar el valor intrínseco de Frontline Ltd.? Nuestra calculadora DCF (FRO) integra datos del mundo real con extensas características de personalización, lo que le permite ajustar los pronósticos y mejorar sus estrategias de inversión.
What You Will Get
- Editable Forecast Inputs: Easily modify key assumptions (growth %, margins, WACC) to explore various scenarios.
- Real-World Data: Frontline Ltd.'s (FRO) financial data pre-filled to facilitate your analysis.
- Automatic DCF Outputs: The template computes Net Present Value (NPV) and intrinsic value automatically.
- Customizable and Professional: A sleek Excel model tailored to meet your valuation requirements.
- Built for Analysts and Investors: Perfect for evaluating projections, confirming strategies, and enhancing efficiency.
Key Features
- 🔍 Real-Life FRO Financials: Pre-filled historical and projected data for Frontline Ltd. (FRO).
- ✏️ Fully Customizable Inputs: Adjust all critical parameters (yellow cells) like WACC, growth %, and tax rates.
- 📊 Professional DCF Valuation: Built-in formulas calculate Frontline’s intrinsic value using the Discounted Cash Flow method.
- ⚡ Instant Results: Visualize Frontline’s valuation instantly after making changes.
- Scenario Analysis: Test and compare outcomes for various financial assumptions side-by-side.
How It Works
- 1. Access the Model: Download and open the Excel file featuring Frontline Ltd. (FRO)’s financial data.
- 2. Adjust Key Inputs: Modify essential variables such as revenue growth, discount rates, and capital investments.
- 3. Analyze Results Immediately: The DCF model automatically computes intrinsic value and net present value (NPV).
- 4. Explore Various Scenarios: Evaluate different forecasts to understand potential valuation variations.
- 5. Present with Assurance: Share expert valuation findings to reinforce your strategic decisions.
Why Choose This Calculator for Frontline Ltd. (FRO)?
- User-Friendly Interface: Perfect for both novice and seasoned users.
- Customizable Parameters: Adjust inputs easily to suit your financial analysis.
- Real-Time Updates: Observe immediate changes to Frontline Ltd.'s (FRO) valuation as you modify inputs.
- Preloaded Data: Comes with Frontline Ltd.'s (FRO) latest financial information for swift evaluations.
- Preferred by Experts: Utilized by investors and analysts for making well-informed choices.
Who Should Use This Product?
- Individual Investors: Make informed decisions about buying or selling Frontline Ltd. (FRO) stock.
- Financial Analysts: Streamline valuation processes with ready-to-use financial models for Frontline Ltd. (FRO).
- Consultants: Deliver professional valuation insights regarding Frontline Ltd. (FRO) to clients quickly and accurately.
- Business Owners: Understand how companies like Frontline Ltd. (FRO) are valued to guide your own strategy.
- Finance Students: Learn valuation techniques using real-world data and scenarios involving Frontline Ltd. (FRO).
What the Template Contains
- Historical Data: Includes Frontline Ltd.'s (FRO) past financials and baseline forecasts.
- DCF and Levered DCF Models: Detailed templates to calculate Frontline Ltd.'s (FRO) intrinsic value.
- WACC Sheet: Pre-built calculations for Weighted Average Cost of Capital.
- Editable Inputs: Modify key drivers like growth rates, EBITDA %, and CAPEX assumptions.
- Quarterly and Annual Statements: A complete breakdown of Frontline Ltd.'s (FRO) financials.
- Interactive Dashboard: Visualize valuation results and projections dynamically.
Disclaimer
All information, articles, and product details provided on this website are for general informational and educational purposes only. We do not claim any ownership over, nor do we intend to infringe upon, any trademarks, copyrights, logos, brand names, or other intellectual property mentioned or depicted on this site. Such intellectual property remains the property of its respective owners, and any references here are made solely for identification or informational purposes, without implying any affiliation, endorsement, or partnership.
We make no representations or warranties, express or implied, regarding the accuracy, completeness, or suitability of any content or products presented. Nothing on this website should be construed as legal, tax, investment, financial, medical, or other professional advice. In addition, no part of this site—including articles or product references—constitutes a solicitation, recommendation, endorsement, advertisement, or offer to buy or sell any securities, franchises, or other financial instruments, particularly in jurisdictions where such activity would be unlawful.
All content is of a general nature and may not address the specific circumstances of any individual or entity. It is not a substitute for professional advice or services. Any actions you take based on the information provided here are strictly at your own risk. You accept full responsibility for any decisions or outcomes arising from your use of this website and agree to release us from any liability in connection with your use of, or reliance upon, the content or products found herein.