
|
Valoración de DCF de FORVIA SE (FRVIA.PA) |
Completamente Editable: Adáptelo A Sus Necesidades En Excel O Sheets
Diseño Profesional: Plantillas Confiables Y Estándares De La Industria
Predeterminadas Para Un Uso Rápido Y Eficiente
Compatible con MAC / PC, completamente desbloqueado
No Se Necesita Experiencia; Fáciles De Seguir
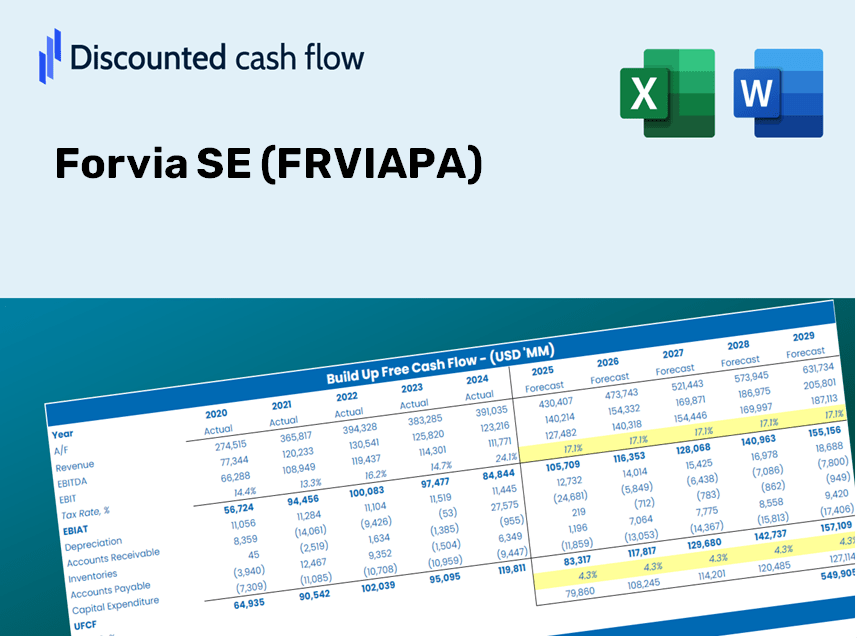
Forvia SE (FRVIA.PA) Bundle
¡Maximice la eficiencia y mejore la precisión con nuestra calculadora DCF (frviapa)! Con datos reales de FORVIA SE y supuestos personalizables, esta herramienta le permite pronosticar, analizar y evaluar Forvis SE como un inversor experimentado.
Discounted Cash Flow (DCF) - (USD MM)
| Year | AY1 2020 |
AY2 2021 |
AY3 2022 |
AY4 2023 |
AY5 2024 |
FY1 2025 |
FY2 2026 |
FY3 2027 |
FY4 2028 |
FY5 2029 |
|---|---|---|---|---|---|---|---|---|---|---|
| Revenue | 14,653.8 | 15,617.8 | 25,458.2 | 27,247.9 | 26,974.2 | 32,073.1 | 38,135.8 | 45,344.6 | 53,916.1 | 64,107.8 |
| Revenue Growth, % | 0 | 6.58 | 63.01 | 7.03 | -1 | 18.9 | 18.9 | 18.9 | 18.9 | 18.9 |
| EBITDA | 876.3 | 1,387.1 | 1,662.2 | 2,561.0 | 2,304.2 | 2,523.0 | 2,999.9 | 3,567.0 | 4,241.2 | 5,042.9 |
| EBITDA, % | 5.98 | 8.88 | 6.53 | 9.4 | 8.54 | 7.87 | 7.87 | 7.87 | 7.87 | 7.87 |
| Depreciation | 824.1 | 853.0 | 1,352.2 | 1,369.2 | 1,116.7 | 1,639.7 | 1,949.6 | 2,318.2 | 2,756.4 | 3,277.4 |
| Depreciation, % | 5.62 | 5.46 | 5.31 | 5.02 | 4.14 | 5.11 | 5.11 | 5.11 | 5.11 | 5.11 |
| EBIT | 52.2 | 534.1 | 310.0 | 1,191.8 | 1,187.5 | 883.3 | 1,050.3 | 1,248.8 | 1,484.8 | 1,765.5 |
| EBIT, % | 0.35622 | 3.42 | 1.22 | 4.37 | 4.4 | 2.75 | 2.75 | 2.75 | 2.75 | 2.75 |
| Total Cash | 3,094.0 | 4,917.6 | 4,218.7 | 4,282.7 | 4,505.7 | 6,516.8 | 7,748.7 | 9,213.4 | 10,955.0 | 13,025.9 |
| Total Cash, percent | .0 | .0 | .0 | .0 | .0 | .0 | .0 | .0 | .0 | .0 |
| Account Receivables | 3,980.4 | 4,394.0 | 6,354.5 | 4,282.5 | 4,352.9 | 7,191.6 | 8,551.0 | 10,167.4 | 12,089.3 | 14,374.5 |
| Account Receivables, % | 27.16 | 28.13 | 24.96 | 15.72 | 16.14 | 22.42 | 22.42 | 22.42 | 22.42 | 22.42 |
| Inventories | 1,431.3 | 1,657.6 | 2,924.2 | 3,026.5 | 2,580.7 | 3,370.4 | 4,007.5 | 4,765.0 | 5,665.7 | 6,736.7 |
| Inventories, % | 9.77 | 10.61 | 11.49 | 11.11 | 9.57 | 10.51 | 10.51 | 10.51 | 10.51 | 10.51 |
| Accounts Payable | 6,016.4 | 6,693.2 | 9,181.3 | 8,397.9 | 8,508.7 | 11,696.5 | 13,907.5 | 16,536.4 | 19,662.3 | 23,379.0 |
| Accounts Payable, % | 41.06 | 42.86 | 36.06 | 30.82 | 31.54 | 36.47 | 36.47 | 36.47 | 36.47 | 36.47 |
| Capital Expenditure | -1,098.2 | -1,199.6 | -2,142.8 | -2,183.3 | -2,011.6 | -2,505.7 | -2,979.4 | -3,542.5 | -4,212.2 | -5,008.4 |
| Capital Expenditure, % | -7.49 | -7.68 | -8.42 | -8.01 | -7.46 | -7.81 | -7.81 | -7.81 | -7.81 | -7.81 |
| Tax Rate, % | 187.73 | 187.73 | 187.73 | 187.73 | 187.73 | 187.73 | 187.73 | 187.73 | 187.73 | 187.73 |
| EBITAT | 106.7 | -152.4 | 1,567.7 | 437.3 | -1,041.8 | 418.1 | 497.2 | 591.2 | 702.9 | 835.8 |
| Depreciation | ||||||||||
| Changes in Account Receivables | ||||||||||
| Changes in Inventories | ||||||||||
| Changes in Accounts Payable | ||||||||||
| Capital Expenditure | ||||||||||
| UFCF | 437.3 | -462.1 | 38.1 | 809.5 | -1,450.5 | -888.4 | -318.1 | -378.2 | -449.7 | -534.7 |
| WACC, % | 6.61 | 1.93 | 6.61 | 3.65 | 1.93 | 4.15 | 4.15 | 4.15 | 4.15 | 4.15 |
| PV UFCF | ||||||||||
| SUM PV UFCF | -2,299.6 | |||||||||
| Long Term Growth Rate, % | 2.00 | |||||||||
| Free cash flow (T + 1) | -545 | |||||||||
| Terminal Value | -25,390 | |||||||||
| Present Terminal Value | -20,721 | |||||||||
| Enterprise Value | -23,021 | |||||||||
| Net Debt | 6,632 | |||||||||
| Equity Value | -29,652 | |||||||||
| Diluted Shares Outstanding, MM | 197 | |||||||||
| Equity Value Per Share | -150.28 |
What You Will Receive
- Real Forvia SE (FRVIAPA) Financials: Offers historical and projected data for precise valuation.
- Customizable Inputs: Adjust WACC, tax rates, revenue growth, and capital expenditures as needed.
- Automated Calculations: Intrinsic value and NPV are computed in real-time.
- Scenario Analysis: Evaluate various scenarios to assess Forvia's future performance.
- User-Friendly Design: Crafted for professionals while remaining accessible to newcomers.
Key Features
- Comprehensive DCF Calculator: Features detailed unlevered and levered DCF valuation models tailored for Forvia SE (FRVIAPA).
- WACC Calculator: Comes with a pre-designed Weighted Average Cost of Capital sheet that allows for customizable inputs.
- Adjustable Forecast Assumptions: Easily modify growth rates, capital expenditures, and discount rates to fit your analysis.
- Integrated Financial Ratios: Assess profitability, leverage, and efficiency ratios specific to Forvia SE (FRVIAPA).
- Interactive Dashboard and Charts: Visual representations provide quick insights into key valuation metrics for streamlined analysis.
How It Functions
- 1. Access the Template: Download and open the Excel file containing Forvia SE's (FRVIAPA) preloaded data.
- 2. Modify Assumptions: Adjust key parameters such as growth rates, WACC, and capital expenditures.
- 3. View Results Instantly: The DCF model automatically computes intrinsic value and NPV for you.
- 4. Explore Scenarios: Evaluate various forecasts to understand different valuation results.
- 5. Use with Assurance: Present expert valuation analyses to back your decisions.
Why Opt for This Calculator?
- User-Friendly Interface: Perfectly crafted for both novices and seasoned users.
- Customizable Input: Adjust parameters effortlessly to suit your analytical needs.
- Real-Time Feedback: Observe immediate changes in Forvia SE’s valuation as you modify inputs.
- Preloaded Data: Comes loaded with Forvia SE's (FRVIAPA) actual financial information for swift evaluation.
- Relied Upon by Experts: Frequently utilized by investors and analysts for strategic decision-making.
Who Can Benefit from Forvia SE (FRVIAPA)?
- Investors: Gain confidence in your investment choices with our advanced valuation tools.
- Financial Analysts: Enhance efficiency with a customizable DCF model designed for your needs.
- Consultants: Seamlessly tailor the template for impactful client presentations and reports.
- Finance Enthusiasts: Expand your knowledge of valuation methods through practical, real-world examples.
- Educators and Students: Utilize this resource as a hands-on learning tool in finance courses.
What the Template Contains
- Preloaded FRVIAPA Data: Historical and projected financial figures, including revenue, EBIT, and capital expenditures.
- DCF and WACC Models: Professional-quality sheets for determining intrinsic value and Weighted Average Cost of Capital.
- Editable Inputs: Yellow-highlighted cells for modifying revenue growth, tax rates, and discount rates.
- Financial Statements: Detailed annual and quarterly financials for in-depth analysis.
- Key Ratios: Profitability, leverage, and efficiency ratios to assess performance.
- Dashboard and Charts: Visual representations of valuation results and underlying assumptions.
Disclaimer
All information, articles, and product details provided on this website are for general informational and educational purposes only. We do not claim any ownership over, nor do we intend to infringe upon, any trademarks, copyrights, logos, brand names, or other intellectual property mentioned or depicted on this site. Such intellectual property remains the property of its respective owners, and any references here are made solely for identification or informational purposes, without implying any affiliation, endorsement, or partnership.
We make no representations or warranties, express or implied, regarding the accuracy, completeness, or suitability of any content or products presented. Nothing on this website should be construed as legal, tax, investment, financial, medical, or other professional advice. In addition, no part of this site—including articles or product references—constitutes a solicitation, recommendation, endorsement, advertisement, or offer to buy or sell any securities, franchises, or other financial instruments, particularly in jurisdictions where such activity would be unlawful.
All content is of a general nature and may not address the specific circumstances of any individual or entity. It is not a substitute for professional advice or services. Any actions you take based on the information provided here are strictly at your own risk. You accept full responsibility for any decisions or outcomes arising from your use of this website and agree to release us from any liability in connection with your use of, or reliance upon, the content or products found herein.