
|
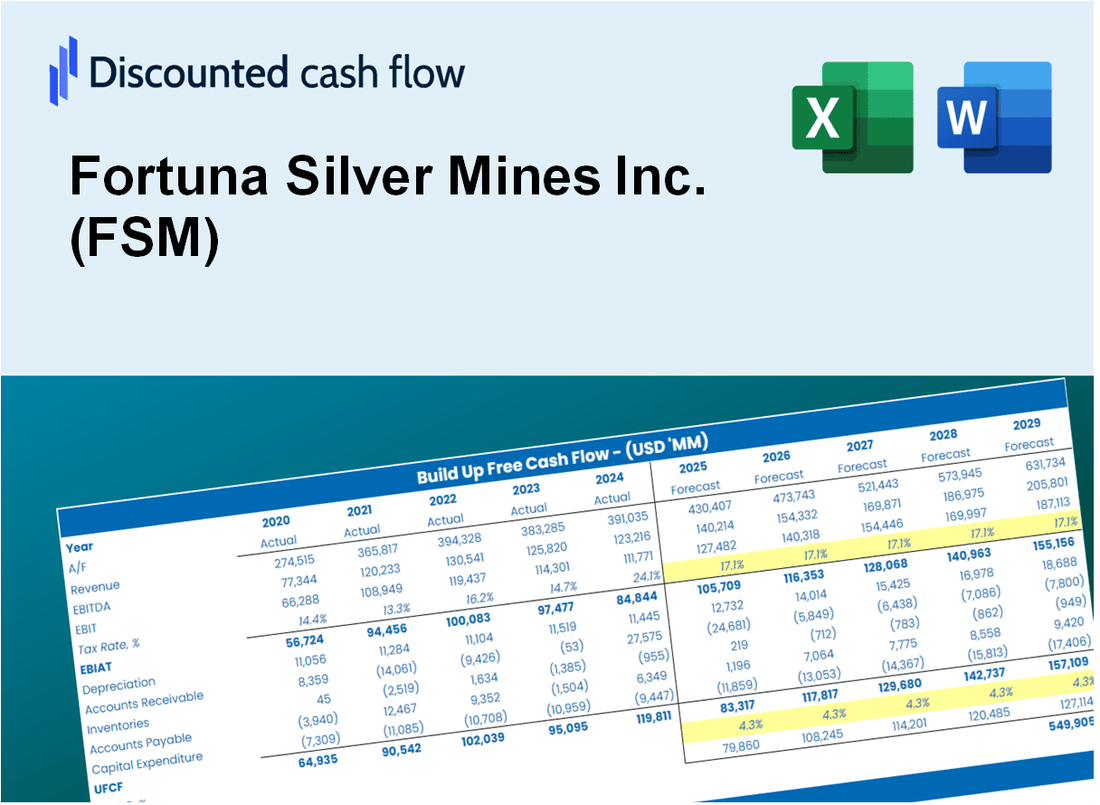
Valoración DCF de Fortuna Silver Mines Inc. (FSM) |
Completamente Editable: Adáptelo A Sus Necesidades En Excel O Sheets
Diseño Profesional: Plantillas Confiables Y Estándares De La Industria
Predeterminadas Para Un Uso Rápido Y Eficiente
Compatible con MAC / PC, completamente desbloqueado
No Se Necesita Experiencia; Fáciles De Seguir
Fortuna Silver Mines Inc. (FSM) Bundle
¡Explore la perspectiva financiera de Fortuna Silver Mines Inc. (FSM) con nuestra calculadora DCF fácil de usar! Ingrese sus proyecciones para el crecimiento, los márgenes y los gastos para calcular el valor intrínseco de Fortuna Silver Mines Inc. (FSM) y mejorar su enfoque de inversión.
Discounted Cash Flow (DCF) - (USD MM)
| Year | AY1 2020 |
AY2 2021 |
AY3 2022 |
AY4 2023 |
AY5 2024 |
FY1 2025 |
FY2 2026 |
FY3 2027 |
FY4 2028 |
FY5 2029 |
|---|---|---|---|---|---|---|---|---|---|---|
| Revenue | 279.0 | 599.9 | 681.5 | 842.4 | 1,062.0 | 1,495.6 | 2,106.2 | 2,966.0 | 4,176.8 | 5,881.9 |
| Revenue Growth, % | 0 | 115.03 | 13.61 | 23.62 | 26.07 | 40.82 | 40.82 | 40.82 | 40.82 | 40.82 |
| EBITDA | 106.6 | 242.0 | 59.1 | 230.8 | 474.3 | 476.5 | 671.0 | 944.9 | 1,330.6 | 1,873.8 |
| EBITDA, % | 38.22 | 40.35 | 8.66 | 27.4 | 44.66 | 31.86 | 31.86 | 31.86 | 31.86 | 31.86 |
| Depreciation | 45.4 | 122.3 | 172.8 | 219.7 | 238.0 | 330.5 | 465.5 | 655.5 | 923.1 | 1,300.0 |
| Depreciation, % | 16.28 | 20.38 | 25.36 | 26.08 | 22.41 | 22.1 | 22.1 | 22.1 | 22.1 | 22.1 |
| EBIT | 61.2 | 119.8 | -113.8 | 11.1 | 236.3 | 145.9 | 205.5 | 289.4 | 407.5 | 573.9 |
| EBIT, % | 21.94 | 19.97 | -16.69 | 1.32 | 22.25 | 9.76 | 9.76 | 9.76 | 9.76 | 9.76 |
| Total Cash | 133.0 | 107.5 | 80.5 | 128.1 | 231.3 | 342.2 | 481.8 | 678.5 | 955.5 | 1,345.6 |
| Total Cash, percent | .0 | .0 | .0 | .0 | .0 | .0 | .0 | .0 | .0 | .0 |
| Account Receivables | 76.6 | 78.2 | 24.0 | 74.6 | 104.1 | 187.4 | 264.0 | 371.7 | 523.5 | 737.2 |
| Account Receivables, % | 27.44 | 13.04 | 3.52 | 8.86 | 9.81 | 12.53 | 12.53 | 12.53 | 12.53 | 12.53 |
| Inventories | 35.3 | 85.8 | 92.0 | 115.8 | 134.5 | 200.0 | 281.7 | 396.7 | 558.6 | 786.6 |
| Inventories, % | 12.64 | 14.31 | 13.5 | 13.75 | 12.66 | 13.37 | 13.37 | 13.37 | 13.37 | 13.37 |
| Accounts Payable | 31.6 | 82.5 | 72.6 | 100.4 | 91.2 | 168.2 | 236.8 | 333.5 | 469.7 | 661.4 |
| Accounts Payable, % | 11.32 | 13.76 | 10.65 | 11.92 | 8.59 | 11.25 | 11.25 | 11.25 | 11.25 | 11.25 |
| Capital Expenditure | -114.3 | -152.3 | -251.2 | -217.3 | -203.8 | -443.4 | -624.3 | -879.2 | -1,238.2 | -1,743.6 |
| Capital Expenditure, % | -40.98 | -25.39 | -36.87 | -25.8 | -19.19 | -29.64 | -29.64 | -29.64 | -29.64 | -29.64 |
| Tax Rate, % | 39.34 | 39.34 | 39.34 | 39.34 | 39.34 | 39.34 | 39.34 | 39.34 | 39.34 | 39.34 |
| EBITAT | 22.4 | 64.7 | -116.5 | 51.1 | 143.3 | 102.5 | 144.3 | 203.3 | 286.3 | 403.1 |
| Depreciation | ||||||||||
| Changes in Account Receivables | ||||||||||
| Changes in Inventories | ||||||||||
| Changes in Accounts Payable | ||||||||||
| Capital Expenditure | ||||||||||
| UFCF | -126.8 | 33.4 | -156.9 | 6.8 | 120.2 | -82.1 | -104.0 | -146.5 | -206.3 | -290.5 |
| WACC, % | 10.84 | 10.99 | 11.39 | 11.39 | 11.05 | 11.13 | 11.13 | 11.13 | 11.13 | 11.13 |
| PV UFCF | ||||||||||
| SUM PV UFCF | -571.5 | |||||||||
| Long Term Growth Rate, % | 2.00 | |||||||||
| Free cash flow (T + 1) | -296 | |||||||||
| Terminal Value | -3,245 | |||||||||
| Present Terminal Value | -1,914 | |||||||||
| Enterprise Value | -2,486 | |||||||||
| Net Debt | -37 | |||||||||
| Equity Value | -2,449 | |||||||||
| Diluted Shares Outstanding, MM | 311 | |||||||||
| Equity Value Per Share | -7.88 |
What You Will Receive
- Customizable Excel Template: A fully adjustable Excel-based DCF Calculator featuring pre-filled real FSM financials.
- Actual Market Data: Historical performance data and future projections (as indicated in the highlighted cells).
- Flexible Forecasting: Adjust forecast parameters such as revenue growth, EBITDA %, and WACC.
- Instant Calculations: Quickly observe how your inputs influence Fortuna’s valuation.
- Professional Resource: Designed for investors, CFOs, consultants, and financial analysts.
- Intuitive Layout: Organized for clarity and simplicity, complete with step-by-step guidance.
Key Features
- Customizable Forecast Inputs: Adjust essential parameters such as silver production, operating costs, and capital investments.
- Instant DCF Valuation: Quickly computes intrinsic value, NPV, and other financial metrics.
- Industry-Leading Precision: Incorporates Fortuna Silver Mines Inc.'s (FSM) actual financial data for accurate valuation results.
- Effortless Scenario Analysis: Easily evaluate various scenarios and analyze their impacts on outcomes.
- Efficiency Booster: Avoid the complexities of creating intricate valuation models from the ground up.
How It Works
- 1. Access the Template: Download and open the Excel file containing Fortuna Silver Mines Inc.'s (FSM) preloaded data.
- 2. Modify Assumptions: Adjust critical inputs such as growth rates, WACC, and capital expenditures.
- 3. View Results Instantly: The DCF model automatically calculates the intrinsic value and NPV.
- 4. Explore Scenarios: Analyze various forecasts to evaluate different valuation results.
- 5. Present with Confidence: Showcase professional valuation insights to bolster your decision-making.
Why Choose This Calculator for Fortuna Silver Mines Inc. (FSM)?
- Comprehensive Tool: Integrates DCF, WACC, and financial ratio analyses tailored for Fortuna Silver Mines.
- Customizable Inputs: Modify the yellow-highlighted cells to explore different investment scenarios.
- Detailed Insights: Automatically computes Fortuna Silver Mines’ intrinsic value and Net Present Value.
- Preloaded Data: Access historical and projected data for accurate analysis.
- Professional Quality: Perfect for financial analysts, investors, and consultants focusing on mining sectors.
Who Should Use This Product?
- Individual Investors: Make informed decisions about buying or selling Fortuna Silver Mines Inc. (FSM) stock.
- Financial Analysts: Streamline valuation processes with ready-to-use financial models specific to Fortuna Silver Mines Inc. (FSM).
- Consultants: Deliver professional valuation insights on Fortuna Silver Mines Inc. (FSM) to clients quickly and accurately.
- Business Owners: Understand how mining companies like Fortuna Silver Mines Inc. (FSM) are valued to guide your own strategy.
- Finance Students: Learn valuation techniques using real-world data and scenarios related to Fortuna Silver Mines Inc. (FSM).
What the Template Contains
- Pre-Filled Data: Contains Fortuna Silver Mines Inc.'s (FSM) historical financials and projections.
- Discounted Cash Flow Model: Editable DCF valuation model featuring automatic calculations.
- Weighted Average Cost of Capital (WACC): A dedicated sheet for WACC calculations based on custom inputs.
- Key Financial Ratios: Assess Fortuna Silver Mines Inc.'s (FSM) profitability, efficiency, and leverage.
- Customizable Inputs: Easily modify revenue growth, margins, and tax rates.
- Clear Dashboard: Visuals and tables summarizing essential valuation outcomes.
Disclaimer
All information, articles, and product details provided on this website are for general informational and educational purposes only. We do not claim any ownership over, nor do we intend to infringe upon, any trademarks, copyrights, logos, brand names, or other intellectual property mentioned or depicted on this site. Such intellectual property remains the property of its respective owners, and any references here are made solely for identification or informational purposes, without implying any affiliation, endorsement, or partnership.
We make no representations or warranties, express or implied, regarding the accuracy, completeness, or suitability of any content or products presented. Nothing on this website should be construed as legal, tax, investment, financial, medical, or other professional advice. In addition, no part of this site—including articles or product references—constitutes a solicitation, recommendation, endorsement, advertisement, or offer to buy or sell any securities, franchises, or other financial instruments, particularly in jurisdictions where such activity would be unlawful.
All content is of a general nature and may not address the specific circumstances of any individual or entity. It is not a substitute for professional advice or services. Any actions you take based on the information provided here are strictly at your own risk. You accept full responsibility for any decisions or outcomes arising from your use of this website and agree to release us from any liability in connection with your use of, or reliance upon, the content or products found herein.