
|
Valoración de DCF Future PLC (FUTR.L) |
Completamente Editable: Adáptelo A Sus Necesidades En Excel O Sheets
Diseño Profesional: Plantillas Confiables Y Estándares De La Industria
Predeterminadas Para Un Uso Rápido Y Eficiente
Compatible con MAC / PC, completamente desbloqueado
No Se Necesita Experiencia; Fáciles De Seguir
Future plc (FUTR.L) Bundle
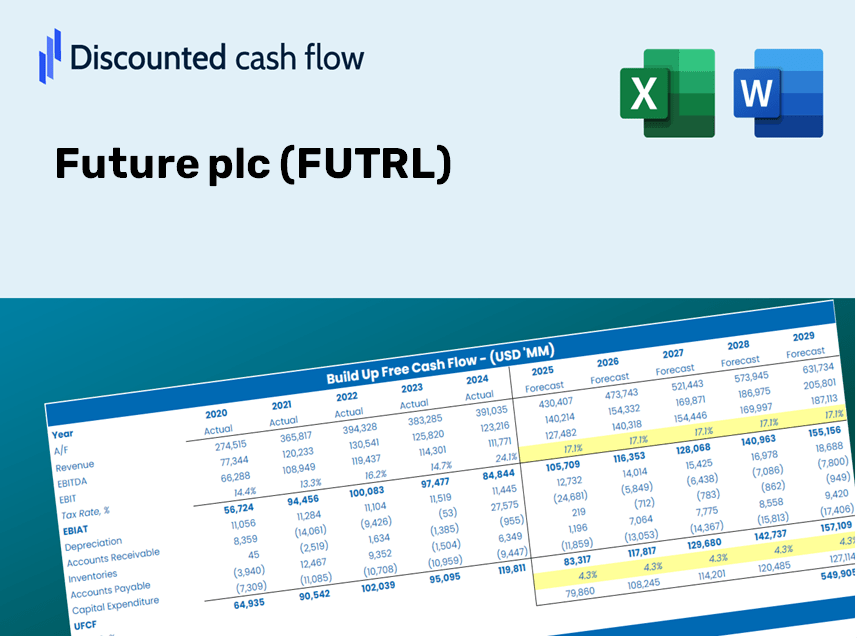
¡Obtenga información sobre su análisis de valoración Future PLC (FUTRL) utilizando nuestra calculadora DCF de última generación! Equipado con datos de FUTRL reales, esta plantilla de Excel le permite ajustar los pronósticos y supuestos para determinar con precisión el valor intrínseco del PLC futuro (FUTRL).
Discounted Cash Flow (DCF) - (USD MM)
| Year | AY1 2020 |
AY2 2021 |
AY3 2022 |
AY4 2023 |
AY5 2024 |
FY1 2025 |
FY2 2026 |
FY3 2027 |
FY4 2028 |
FY5 2029 |
|---|---|---|---|---|---|---|---|---|---|---|
| Revenue | 339.6 | 606.8 | 825.4 | 788.9 | 788.2 | 814.0 | 840.7 | 868.3 | 896.8 | 926.2 |
| Revenue Growth, % | 0 | 78.68 | 36.03 | -4.42 | -0.08873114 | 3.28 | 3.28 | 3.28 | 3.28 | 3.28 |
| EBITDA | 85.1 | 200.1 | 269.1 | 253.9 | 214.7 | 244.3 | 252.3 | 260.6 | 269.1 | 278.0 |
| EBITDA, % | 25.06 | 32.98 | 32.6 | 32.18 | 27.24 | 30.01 | 30.01 | 30.01 | 30.01 | 30.01 |
| Depreciation | 30.1 | 57.4 | 80.4 | 79.8 | 83.6 | 79.4 | 82.0 | 84.7 | 87.5 | 90.4 |
| Depreciation, % | 8.86 | 9.46 | 9.74 | 10.12 | 10.61 | 9.76 | 9.76 | 9.76 | 9.76 | 9.76 |
| EBIT | 55.0 | 142.7 | 188.7 | 174.1 | 131.1 | 164.9 | 170.3 | 175.9 | 181.6 | 187.6 |
| EBIT, % | 16.2 | 23.52 | 22.86 | 22.07 | 16.63 | 20.26 | 20.26 | 20.26 | 20.26 | 20.26 |
| Total Cash | 19.3 | 324.3 | 29.2 | 60.3 | 39.7 | 122.7 | 126.7 | 130.8 | 135.1 | 139.6 |
| Total Cash, percent | .0 | .0 | .0 | .0 | .0 | .0 | .0 | .0 | .0 | .0 |
| Account Receivables | 54.5 | 99.9 | 153.8 | 127.1 | 115.3 | 133.3 | 137.7 | 142.2 | 146.9 | 151.7 |
| Account Receivables, % | 16.05 | 16.46 | 18.63 | 16.11 | 14.63 | 16.38 | 16.38 | 16.38 | 16.38 | 16.38 |
| Inventories | .7 | 1.0 | 1.2 | 1.3 | .4 | 1.2 | 1.2 | 1.3 | 1.3 | 1.4 |
| Inventories, % | 0.20612 | 0.1648 | 0.14538 | 0.16479 | 0.05074854 | 0.14637 | 0.14637 | 0.14637 | 0.14637 | 0.14637 |
| Accounts Payable | 25.4 | 25.8 | 28.8 | 26.0 | 121.7 | 55.3 | 57.1 | 59.0 | 60.9 | 62.9 |
| Accounts Payable, % | 7.48 | 4.25 | 3.49 | 3.3 | 15.44 | 6.79 | 6.79 | 6.79 | 6.79 | 6.79 |
| Capital Expenditure | -6.3 | -11.1 | -11.6 | -11.3 | -13.9 | -13.5 | -13.9 | -14.4 | -14.9 | -15.3 |
| Capital Expenditure, % | -1.86 | -1.83 | -1.41 | -1.43 | -1.76 | -1.66 | -1.66 | -1.66 | -1.66 | -1.66 |
| Tax Rate, % | 25.58 | 25.58 | 25.58 | 25.58 | 25.58 | 25.58 | 25.58 | 25.58 | 25.58 | 25.58 |
| EBITAT | 46.9 | 87.5 | 135.6 | 143.0 | 97.6 | 123.6 | 127.7 | 131.9 | 136.2 | 140.7 |
| Depreciation | ||||||||||
| Changes in Account Receivables | ||||||||||
| Changes in Inventories | ||||||||||
| Changes in Accounts Payable | ||||||||||
| Capital Expenditure | ||||||||||
| UFCF | 40.9 | 88.5 | 153.3 | 235.3 | 275.7 | 104.4 | 193.2 | 199.5 | 206.1 | 212.8 |
| WACC, % | 9.51 | 8.78 | 9.1 | 9.42 | 9.18 | 9.2 | 9.2 | 9.2 | 9.2 | 9.2 |
| PV UFCF | ||||||||||
| SUM PV UFCF | 692.8 | |||||||||
| Long Term Growth Rate, % | 0.50 | |||||||||
| Free cash flow (T + 1) | 214 | |||||||||
| Terminal Value | 2,460 | |||||||||
| Present Terminal Value | 1,584 | |||||||||
| Enterprise Value | 2,277 | |||||||||
| Net Debt | 295 | |||||||||
| Equity Value | 1,982 | |||||||||
| Diluted Shares Outstanding, MM | 115 | |||||||||
| Equity Value Per Share | 1,722.99 |
What You Will Receive
- Genuine Future plc Data: Comprehensive financials – including revenue and EBIT – based on historical and forecasted figures.
- Complete Customization: Modify all essential parameters (highlighted cells) such as WACC, growth rates, and tax percentages.
- Instant Valuation Adjustments: Automatic updates to evaluate the effects of any changes on Future plc's fair value.
- Flexible Excel Template: Designed for easy modifications, scenario analysis, and in-depth projections.
- Efficient and Precise: Eliminate the hassle of building models from the ground up while ensuring accuracy and adaptability.
Key Features
- Pre-Loaded Data: Future plc’s historical financial statements and pre-filled forecasts.
- Fully Adjustable Inputs: Modify WACC, tax rates, revenue growth, and EBITDA margins to suit your analysis.
- Instant Results: View Future plc’s intrinsic value recalculated in real time.
- Clear Visual Outputs: Interactive dashboard charts present valuation results and essential metrics.
- Built for Accuracy: A professional-grade tool designed for analysts, investors, and finance professionals.
How It Functions
- Step 1: Download the Excel spreadsheet.
- Step 2: Examine the pre-filled Future plc (FUTRL) data (both historical and forecasted).
- Step 3: Modify key assumptions (highlighted cells) according to your findings.
- Step 4: Observe automatic updates reflecting Future plc's (FUTRL) intrinsic value.
- Step 5: Utilize the results for making investment choices or for reporting purposes.
Why Opt for This Calculator?
- Designed for Experts: A sophisticated tool utilized by analysts, CFOs, and consultants.
- Real-Time Data: Future plc's (FUTRL) historical and projected financials readily available for precision.
- Scenario Analysis: Effortlessly simulate various forecasts and assumptions.
- Clear Results: Instantly computes intrinsic value, NPV, and essential metrics.
- User-Friendly: Step-by-step guidance ensures a smooth experience.
Who Can Benefit from This Product?
- Investors: Evaluate Future plc’s valuation before making stock transactions.
- CFOs and Financial Analysts: Optimize valuation workflows and validate financial forecasts.
- Startup Founders: Discover the valuation methods used by leading companies like Future plc (FUTRL).
- Consultants: Create comprehensive valuation reports for your clients.
- Students and Educators: Utilize real-world examples to enhance learning and practice valuation skills.
Contents of the Template
- Comprehensive DCF Model: A fully editable template featuring intricate valuation calculations.
- Real-World Data: Future plc’s (FUTRL) historical and projected financial figures preloaded for in-depth analysis.
- Customizable Parameters: Modify WACC, growth rates, and tax assumptions to explore various scenarios.
- Financial Statements: Detailed annual and quarterly breakdowns providing deeper insights.
- Key Ratios: Integrated analysis for assessing profitability, efficiency, and leverage metrics.
- Dashboard with Visual Outputs: Interactive charts and tables presenting clear, actionable insights.
Disclaimer
All information, articles, and product details provided on this website are for general informational and educational purposes only. We do not claim any ownership over, nor do we intend to infringe upon, any trademarks, copyrights, logos, brand names, or other intellectual property mentioned or depicted on this site. Such intellectual property remains the property of its respective owners, and any references here are made solely for identification or informational purposes, without implying any affiliation, endorsement, or partnership.
We make no representations or warranties, express or implied, regarding the accuracy, completeness, or suitability of any content or products presented. Nothing on this website should be construed as legal, tax, investment, financial, medical, or other professional advice. In addition, no part of this site—including articles or product references—constitutes a solicitation, recommendation, endorsement, advertisement, or offer to buy or sell any securities, franchises, or other financial instruments, particularly in jurisdictions where such activity would be unlawful.
All content is of a general nature and may not address the specific circumstances of any individual or entity. It is not a substitute for professional advice or services. Any actions you take based on the information provided here are strictly at your own risk. You accept full responsibility for any decisions or outcomes arising from your use of this website and agree to release us from any liability in connection with your use of, or reliance upon, the content or products found herein.