
|
Valoración DCF de FVCBankcorp, Inc. (FVCB) |
Completamente Editable: Adáptelo A Sus Necesidades En Excel O Sheets
Diseño Profesional: Plantillas Confiables Y Estándares De La Industria
Predeterminadas Para Un Uso Rápido Y Eficiente
Compatible con MAC / PC, completamente desbloqueado
No Se Necesita Experiencia; Fáciles De Seguir
FVCBankcorp, Inc. (FVCB) Bundle
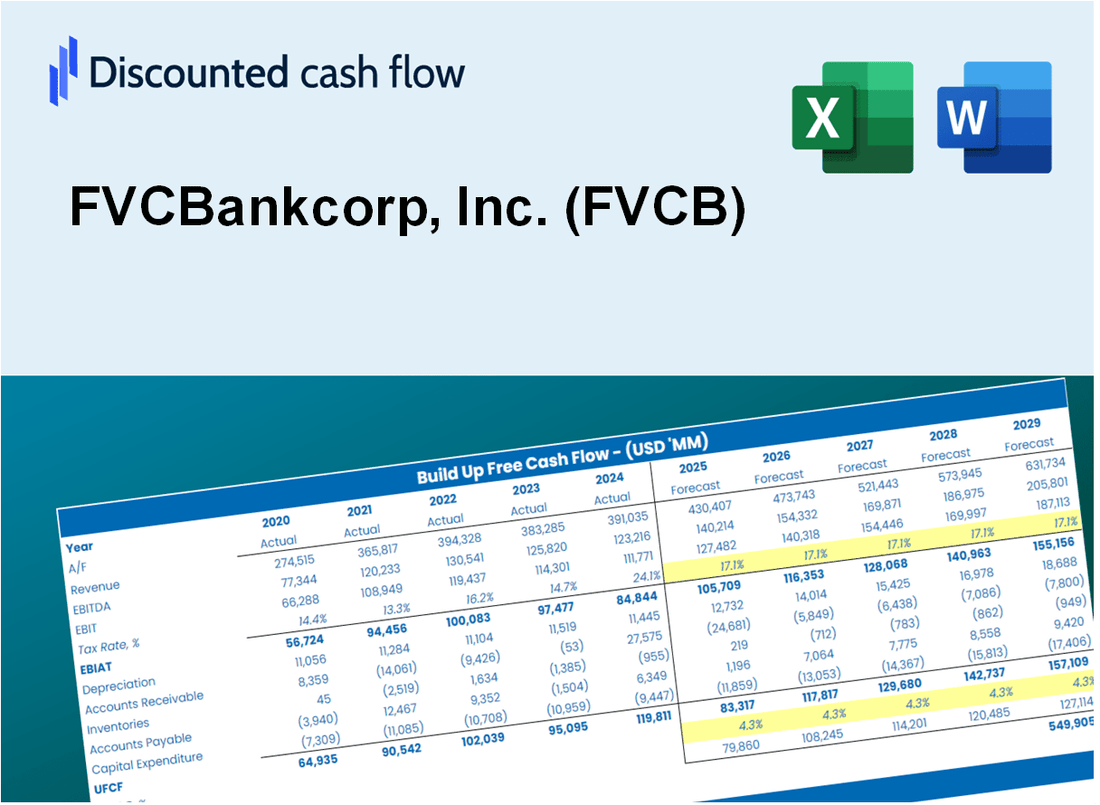
¡Simplifique la valoración de FVCBankCorp, Inc. (FVCB) con esta calculadora DCF personalizable! Con FVCBankCorp real, Inc. (FVCB) financieras y entradas de pronóstico ajustables, puede probar escenarios y descubrir el valor razonable de FVCBankCorp, Inc. (FVCB) en minutos.
Discounted Cash Flow (DCF) - (USD MM)
| Year | AY1 2020 |
AY2 2021 |
AY3 2022 |
AY4 2023 |
AY5 2024 |
FY1 2025 |
FY2 2026 |
FY3 2027 |
FY4 2028 |
FY5 2029 |
|---|---|---|---|---|---|---|---|---|---|---|
| Revenue | 68.9 | 70.3 | 83.0 | 91.9 | 111.6 | 126.2 | 142.6 | 161.3 | 182.3 | 206.1 |
| Revenue Growth, % | 0 | 1.96 | 18.13 | 10.68 | 21.47 | 13.06 | 13.06 | 13.06 | 13.06 | 13.06 |
| EBITDA | 20.6 | 29.1 | 31.7 | 4.8 | 22.7 | 34.1 | 38.5 | 43.6 | 49.3 | 55.7 |
| EBITDA, % | 29.92 | 41.38 | 38.17 | 5.25 | 20.38 | 27.02 | 27.02 | 27.02 | 27.02 | 27.02 |
| Depreciation | 1.0 | .9 | .7 | .6 | .4 | 1.1 | 1.3 | 1.4 | 1.6 | 1.9 |
| Depreciation, % | 1.39 | 1.22 | 0.82657 | 0.64772 | 0.39881 | 0.89808 | 0.89808 | 0.89808 | 0.89808 | 0.89808 |
| EBIT | 19.7 | 28.2 | 31.0 | 4.2 | 22.3 | 33.0 | 37.3 | 42.1 | 47.6 | 53.8 |
| EBIT, % | 28.53 | 40.15 | 37.34 | 4.61 | 19.98 | 26.12 | 26.12 | 26.12 | 26.12 | 26.12 |
| Total Cash | 267.2 | 598.6 | 359.6 | 232.1 | 247.4 | 126.2 | 142.6 | 161.3 | 182.3 | 206.1 |
| Total Cash, percent | .0 | .0 | .0 | .0 | .0 | .0 | .0 | .0 | .0 | .0 |
| Account Receivables | 9.1 | 8.1 | 9.4 | 10.3 | 10.3 | 14.3 | 16.1 | 18.3 | 20.6 | 23.3 |
| Account Receivables, % | 13.26 | 11.49 | 11.37 | 11.24 | 9.24 | 11.32 | 11.32 | 11.32 | 11.32 | 11.32 |
| Inventories | .0 | .0 | .0 | .0 | .0 | .0 | .0 | .0 | .0 | .0 |
| Inventories, % | 0 | 0 | 0 | 0 | 0 | 0 | 0 | 0 | 0 | 0 |
| Accounts Payable | .7 | 1.0 | 1.3 | 2.4 | 2.5 | 2.2 | 2.5 | 2.9 | 3.2 | 3.7 |
| Accounts Payable, % | 0.99409 | 1.47 | 1.53 | 2.63 | 2.25 | 1.77 | 1.77 | 1.77 | 1.77 | 1.77 |
| Capital Expenditure | -.4 | -.5 | -.2 | -.2 | -.1 | -.4 | -.5 | -.6 | -.6 | -.7 |
| Capital Expenditure, % | -0.51228 | -0.69034 | -0.20001 | -0.23079 | -0.12637 | -0.35196 | -0.35196 | -0.35196 | -0.35196 | -0.35196 |
| Tax Rate, % | 32.44 | 32.44 | 32.44 | 32.44 | 32.44 | 32.44 | 32.44 | 32.44 | 32.44 | 32.44 |
| EBITAT | 15.5 | 21.9 | 25.0 | 3.8 | 15.1 | 26.0 | 29.4 | 33.3 | 37.6 | 42.5 |
| Depreciation | ||||||||||
| Changes in Account Receivables | ||||||||||
| Changes in Inventories | ||||||||||
| Changes in Accounts Payable | ||||||||||
| Capital Expenditure | ||||||||||
| UFCF | 7.7 | 23.7 | 24.4 | 4.5 | 15.5 | 22.5 | 28.6 | 32.4 | 36.6 | 41.4 |
| WACC, % | 18.71 | 18.5 | 19.03 | 20.83 | 16.61 | 18.74 | 18.74 | 18.74 | 18.74 | 18.74 |
| PV UFCF | ||||||||||
| SUM PV UFCF | 94.6 | |||||||||
| Long Term Growth Rate, % | 2.00 | |||||||||
| Free cash flow (T + 1) | 42 | |||||||||
| Terminal Value | 252 | |||||||||
| Present Terminal Value | 107 | |||||||||
| Enterprise Value | 202 | |||||||||
| Net Debt | -15 | |||||||||
| Equity Value | 216 | |||||||||
| Diluted Shares Outstanding, MM | 18 | |||||||||
| Equity Value Per Share | 11.75 |
What You Will Get
- Comprehensive FVCB Financials: Access to historical and projected data for precise valuation.
- Customizable Parameters: Adjust WACC, tax rates, revenue growth, and capital expenditures to fit your analysis.
- Dynamic Calculations: Intrinsic value and NPV are computed in real-time.
- Scenario Testing: Evaluate various scenarios to assess FVCBankcorp's future performance.
- User-Friendly Interface: Designed for professionals while remaining approachable for newcomers.
Key Features
- Comprehensive Financial Data: FVCBankcorp’s historical financial statements and projected forecasts.
- Customizable Parameters: Adjust WACC, tax rates, revenue growth, and EBITDA margins as needed.
- Real-Time Insights: Observe FVCBankcorp’s intrinsic value update instantly.
- Intuitive Visualizations: Dashboard graphs showcase valuation outcomes and essential metrics.
- Designed for Precision: A professional-grade tool tailored for analysts, investors, and finance professionals.
How It Works
- 1. Open the Template: Download and open the Excel file containing FVCBankcorp, Inc. (FVCB) preloaded data.
- 2. Edit Assumptions: Modify key inputs such as growth rates, WACC, and capital expenditures.
- 3. View Results Instantly: The DCF model automatically calculates the intrinsic value and NPV.
- 4. Test Scenarios: Evaluate multiple forecasts to explore various valuation outcomes.
- 5. Use with Confidence: Present professional valuation insights to enhance your decision-making.
Why Choose FVCBankcorp, Inc. (FVCB) Calculator?
- Accuracy: Leverage precise financial data from FVCBankcorp for reliable results.
- Flexibility: Tailored for users to easily adjust and experiment with various inputs.
- Time-Saving: Eliminate the need to create a financial model from the ground up.
- Professional-Grade: Crafted with the expertise and standards expected by financial professionals.
- User-Friendly: Intuitive design ensures accessibility for users with all levels of financial knowledge.
Who Should Use This Product?
- Investors: Accurately assess FVCBankcorp, Inc.'s (FVCB) fair value before making investment choices.
- CFOs: Utilize a professional-grade DCF model for comprehensive financial reporting and analysis for FVCB.
- Consultants: Efficiently modify the template for valuation reports tailored to FVCB clients.
- Entrepreneurs: Discover insights into financial modeling practices employed by established banking institutions like FVCB.
- Educators: Implement it as a teaching resource to illustrate valuation techniques relevant to FVCB.
What the Template Contains
- Historical Data: Includes FVCBankcorp, Inc.'s (FVCB) past financials and baseline forecasts.
- DCF and Levered DCF Models: Detailed templates to calculate FVCBankcorp, Inc.'s (FVCB) intrinsic value.
- WACC Sheet: Pre-built calculations for Weighted Average Cost of Capital for FVCBankcorp, Inc. (FVCB).
- Editable Inputs: Modify key drivers like growth rates, EBITDA %, and CAPEX assumptions for FVCBankcorp, Inc. (FVCB).
- Quarterly and Annual Statements: A complete breakdown of FVCBankcorp, Inc.'s (FVCB) financials.
- Interactive Dashboard: Visualize valuation results and projections dynamically for FVCBankcorp, Inc. (FVCB).
Disclaimer
All information, articles, and product details provided on this website are for general informational and educational purposes only. We do not claim any ownership over, nor do we intend to infringe upon, any trademarks, copyrights, logos, brand names, or other intellectual property mentioned or depicted on this site. Such intellectual property remains the property of its respective owners, and any references here are made solely for identification or informational purposes, without implying any affiliation, endorsement, or partnership.
We make no representations or warranties, express or implied, regarding the accuracy, completeness, or suitability of any content or products presented. Nothing on this website should be construed as legal, tax, investment, financial, medical, or other professional advice. In addition, no part of this site—including articles or product references—constitutes a solicitation, recommendation, endorsement, advertisement, or offer to buy or sell any securities, franchises, or other financial instruments, particularly in jurisdictions where such activity would be unlawful.
All content is of a general nature and may not address the specific circumstances of any individual or entity. It is not a substitute for professional advice or services. Any actions you take based on the information provided here are strictly at your own risk. You accept full responsibility for any decisions or outcomes arising from your use of this website and agree to release us from any liability in connection with your use of, or reliance upon, the content or products found herein.