
|
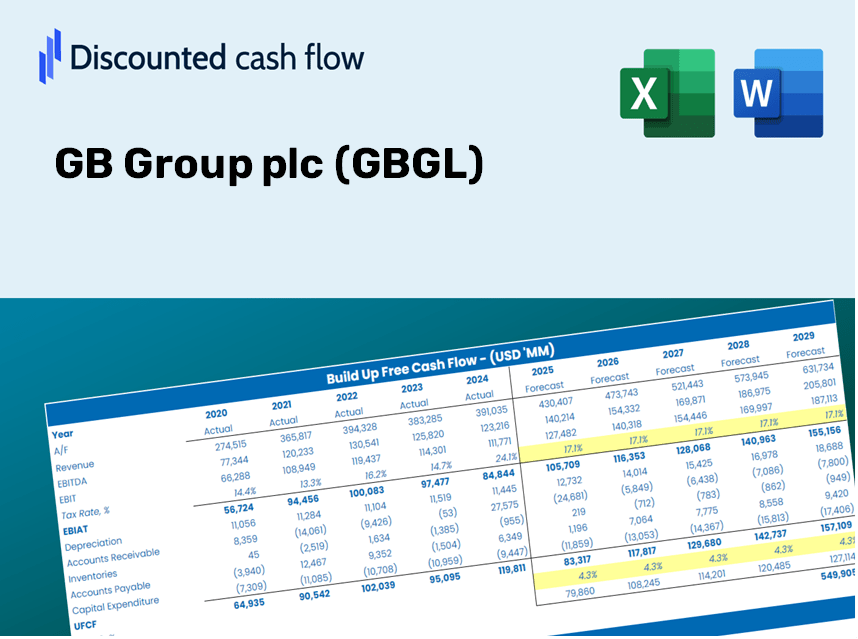
Valoración de DCF GB Group PLC (GBG.L) |
Completamente Editable: Adáptelo A Sus Necesidades En Excel O Sheets
Diseño Profesional: Plantillas Confiables Y Estándares De La Industria
Predeterminadas Para Un Uso Rápido Y Eficiente
Compatible con MAC / PC, completamente desbloqueado
No Se Necesita Experiencia; Fáciles De Seguir
GB Group plc (GBG.L) Bundle
¡Explore el futuro financiero de GB Group PLC (GBGL) con nuestra calculadora DCF fácil de usar! Ingrese sus proyecciones para el crecimiento, los márgenes y los gastos para calcular el valor intrínseco de GB Group PLC (GBGL) y mejorar su enfoque de inversión.
Discounted Cash Flow (DCF) - (USD MM)
| Year | AY1 2021 |
AY2 2022 |
AY3 2023 |
AY4 2024 |
AY5 2025 |
FY1 2026 |
FY2 2027 |
FY3 2028 |
FY4 2029 |
FY5 2030 |
|---|---|---|---|---|---|---|---|---|---|---|
| Revenue | 217.7 | 242.5 | 278.8 | 277.3 | 282.7 | 302.4 | 323.4 | 345.9 | 369.9 | 395.6 |
| Revenue Growth, % | 0 | 11.4 | 14.98 | -0.53262 | 1.94 | 6.95 | 6.95 | 6.95 | 6.95 | 6.95 |
| EBITDA | 56.8 | 51.5 | -66.0 | 1.0 | 59.4 | 27.2 | 29.1 | 31.1 | 33.3 | 35.6 |
| EBITDA, % | 26.09 | 21.25 | -23.68 | 0.34364 | 21.01 | 9 | 9 | 9 | 9 | 9 |
| Depreciation | 21.2 | 28.1 | 46.1 | 42.1 | 36.8 | 39.9 | 42.7 | 45.7 | 48.8 | 52.2 |
| Depreciation, % | 9.73 | 11.59 | 16.53 | 15.17 | 13.02 | 13.21 | 13.21 | 13.21 | 13.21 | 13.21 |
| EBIT | 35.6 | 23.4 | -112.1 | -41.1 | 22.6 | -12.7 | -13.6 | -14.5 | -15.5 | -16.6 |
| EBIT, % | 16.36 | 9.67 | -40.21 | -14.82 | 7.99 | -4.2 | -4.2 | -4.2 | -4.2 | -4.2 |
| Total Cash | 21.1 | 22.3 | 21.6 | 21.3 | 25.2 | 26.1 | 28.0 | 29.9 | 32.0 | 34.2 |
| Total Cash, percent | .0 | .0 | .0 | .0 | .0 | .0 | .0 | .0 | .0 | .0 |
| Account Receivables | .0 | .0 | .0 | 66.3 | 62.5 | 27.8 | 29.8 | 31.8 | 34.0 | 36.4 |
| Account Receivables, % | 0 | 0 | 0 | 23.92 | 22.1 | 9.2 | 9.2 | 9.2 | 9.2 | 9.2 |
| Inventories | .1 | 1.2 | 2.6 | 1.3 | 1.6 | 1.5 | 1.6 | 1.7 | 1.9 | 2.0 |
| Inventories, % | 0.05651041 | 0.49324 | 0.93935 | 0.47453 | 0.55816 | 0.50436 | 0.50436 | 0.50436 | 0.50436 | 0.50436 |
| Accounts Payable | 6.3 | 10.6 | 11.4 | 13.6 | 12.6 | 12.5 | 13.4 | 14.3 | 15.3 | 16.4 |
| Accounts Payable, % | 2.92 | 4.35 | 4.1 | 4.89 | 4.46 | 4.14 | 4.14 | 4.14 | 4.14 | 4.14 |
| Capital Expenditure | -.7 | -1.7 | -1.0 | -.5 | -.8 | -1.1 | -1.2 | -1.3 | -1.4 | -1.5 |
| Capital Expenditure, % | -0.33906 | -0.71387 | -0.36763 | -0.16479 | -0.27094 | -0.37126 | -0.37126 | -0.37126 | -0.37126 | -0.37126 |
| Tax Rate, % | 45.12 | 45.12 | 45.12 | 45.12 | 45.12 | 45.12 | 45.12 | 45.12 | 45.12 | 45.12 |
| EBITAT | 27.9 | 16.5 | -113.0 | -39.6 | 12.4 | -10.2 | -10.9 | -11.6 | -12.4 | -13.3 |
| Depreciation | ||||||||||
| Changes in Account Receivables | ||||||||||
| Changes in Inventories | ||||||||||
| Changes in Accounts Payable | ||||||||||
| Capital Expenditure | ||||||||||
| UFCF | 54.6 | 46.0 | -68.5 | -60.9 | 51.0 | 63.3 | 29.5 | 31.5 | 33.7 | 36.0 |
| WACC, % | 4.97 | 4.89 | 5.18 | 5.15 | 4.73 | 4.98 | 4.98 | 4.98 | 4.98 | 4.98 |
| PV UFCF | ||||||||||
| SUM PV UFCF | 170.2 | |||||||||
| Long Term Growth Rate, % | 2.00 | |||||||||
| Free cash flow (T + 1) | 37 | |||||||||
| Terminal Value | 1,232 | |||||||||
| Present Terminal Value | 966 | |||||||||
| Enterprise Value | 1,136 | |||||||||
| Net Debt | 49 | |||||||||
| Equity Value | 1,087 | |||||||||
| Diluted Shares Outstanding, MM | 255 | |||||||||
| Equity Value Per Share | 426.01 |
What You Will Receive
- Customizable Excel Template: A fully adjustable Excel-based DCF Calculator featuring pre-filled financial data for GB Group plc (GBGL).
- Comprehensive Data: Access to historical figures and future projections (highlighted in the yellow cells).
- Forecast Adjustment: Modify key assumptions such as revenue growth, EBITDA %, and WACC to suit your analysis.
- Instant Calculations: Quickly view how your inputs affect the valuation of GB Group plc (GBGL).
- Professional Resource: Designed for investors, CFOs, consultants, and financial analysts alike.
- User-Centric Layout: Organized for simplicity and ease of navigation, complete with step-by-step guidelines.
Key Features
- Customizable Forecast Inputs: Adjust essential parameters such as revenue growth, EBITDA %, and capital expenditures with ease.
- Instant DCF Valuation: Quickly computes intrinsic value, NPV, and other key financial metrics.
- Industry-Leading Precision: Leverages GB Group plc's (GBGL) actual financial data for accurate valuation results.
- Simplified Scenario Analysis: Effortlessly explore various assumptions and analyze their impacts.
- Efficiency Booster: Streamlines the valuation process, eliminating the hassle of developing intricate models from the ground up.
How It Functions
- 1. Access the Template: Download and open the Excel file containing GB Group plc’s [GBGL] preloaded data.
- 2. Modify Assumptions: Adjust critical inputs such as growth rates, WACC, and capital expenditures.
- 3. Instant Results: The DCF model automatically computes intrinsic value and NPV in real-time.
- 4. Explore Scenarios: Evaluate various forecasts to examine different valuation results.
- 5. Present with Assurance: Share expert valuation insights to bolster your decision-making process.
Why Choose the GB Group plc (GBGL) Calculator?
- All-in-One Solution: Combines DCF, WACC, and financial ratio assessments in a single platform.
- Flexible Parameters: Modify the yellow-highlighted cells to explore different scenarios.
- In-Depth Analysis: Automatically computes GB Group plc’s intrinsic value and Net Present Value.
- Preloaded Information: Utilizes historical and projected data for precise calculations.
- High-Quality Standards: Perfectly suited for financial analysts, investors, and business advisors.
Who Can Benefit from This Product?
- Individual Investors: Gain valuable insights to make informed decisions regarding the purchase or sale of GB Group plc (GBGL) shares.
- Financial Analysts: Enhance your valuation processes with comprehensive financial models tailored for GB Group plc (GBGL).
- Consultants: Provide clients with precise valuation analysis for GB Group plc (GBGL) swiftly and effectively.
- Business Owners: Learn how major companies like GB Group plc (GBGL) are appraised to inform your strategic planning.
- Finance Students: Explore valuation methods using actual data and case studies related to GB Group plc (GBGL).
Contents of the Template
- Pre-Filled Data: Features GB Group plc's historical financials and projections.
- Discounted Cash Flow Model: A customizable DCF valuation model with automatic calculations.
- Weighted Average Cost of Capital (WACC): A dedicated worksheet for WACC computation based on user-defined inputs.
- Key Financial Ratios: Evaluate GB Group plc's profitability, efficiency, and financial leverage.
- Customizable Inputs: Easily modify revenue growth rates, profit margins, and tax rates.
- User-Friendly Dashboard: Visuals and tables summarizing essential valuation metrics.
Disclaimer
All information, articles, and product details provided on this website are for general informational and educational purposes only. We do not claim any ownership over, nor do we intend to infringe upon, any trademarks, copyrights, logos, brand names, or other intellectual property mentioned or depicted on this site. Such intellectual property remains the property of its respective owners, and any references here are made solely for identification or informational purposes, without implying any affiliation, endorsement, or partnership.
We make no representations or warranties, express or implied, regarding the accuracy, completeness, or suitability of any content or products presented. Nothing on this website should be construed as legal, tax, investment, financial, medical, or other professional advice. In addition, no part of this site—including articles or product references—constitutes a solicitation, recommendation, endorsement, advertisement, or offer to buy or sell any securities, franchises, or other financial instruments, particularly in jurisdictions where such activity would be unlawful.
All content is of a general nature and may not address the specific circumstances of any individual or entity. It is not a substitute for professional advice or services. Any actions you take based on the information provided here are strictly at your own risk. You accept full responsibility for any decisions or outcomes arising from your use of this website and agree to release us from any liability in connection with your use of, or reliance upon, the content or products found herein.