
|
Valoración DCF de Golden Entertainment, Inc. (GDEN) |
Completamente Editable: Adáptelo A Sus Necesidades En Excel O Sheets
Diseño Profesional: Plantillas Confiables Y Estándares De La Industria
Predeterminadas Para Un Uso Rápido Y Eficiente
Compatible con MAC / PC, completamente desbloqueado
No Se Necesita Experiencia; Fáciles De Seguir
Golden Entertainment, Inc. (GDEN) Bundle
Ingementista para su precisión, nuestra calculadora GDEN DCF le permite evaluar la valoración de Golden Entertainment, Inc. utilizando datos financieros del mundo real y ofrece una flexibilidad completa para modificar todos los parámetros clave para las proyecciones mejoradas.
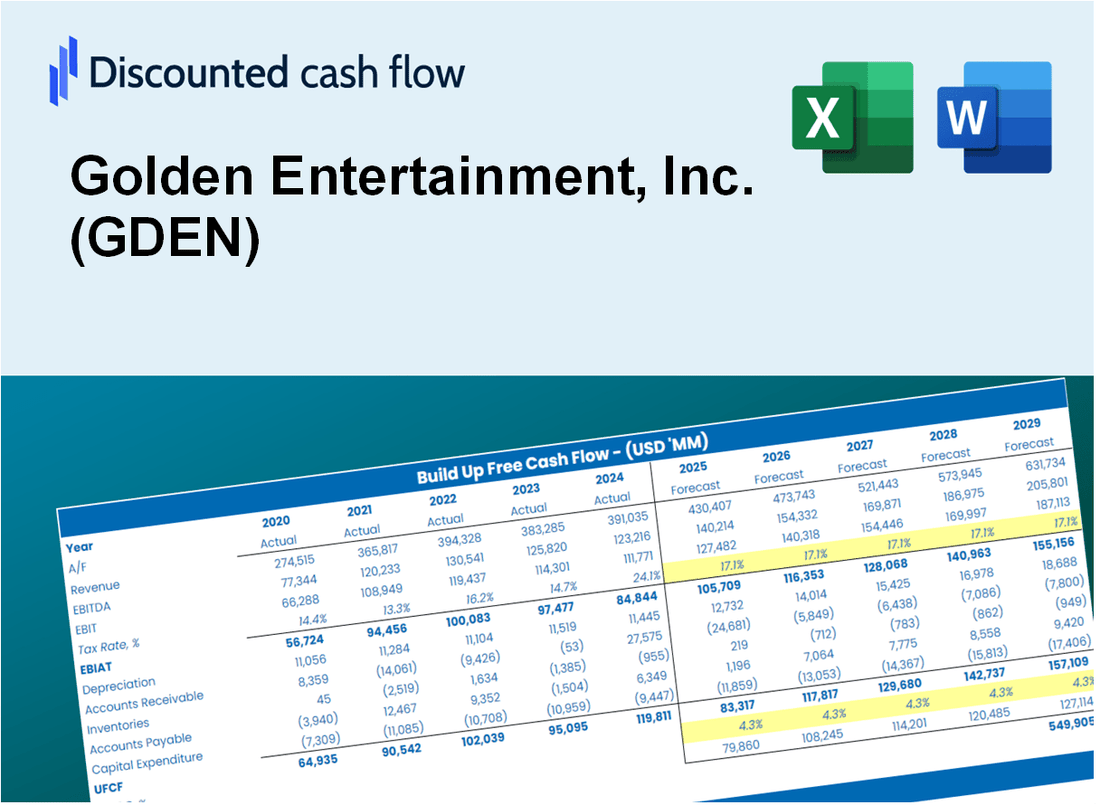
Discounted Cash Flow (DCF) - (USD MM)
| Year | AY1 2020 |
AY2 2021 |
AY3 2022 |
AY4 2023 |
AY5 2024 |
FY1 2025 |
FY2 2026 |
FY3 2027 |
FY4 2028 |
FY5 2029 |
|---|---|---|---|---|---|---|---|---|---|---|
| Revenue | 694.2 | 1,096.5 | 1,121.7 | 1,053.1 | 666.8 | 695.9 | 726.3 | 758.0 | 791.1 | 825.7 |
| Revenue Growth, % | 0 | 57.97 | 2.3 | -6.11 | -36.68 | 4.37 | 4.37 | 4.37 | 4.37 | 4.37 |
| EBITDA | 57.0 | 331.8 | 246.5 | 486.4 | 197.7 | 189.7 | 198.0 | 206.6 | 215.6 | 225.0 |
| EBITDA, % | 8.21 | 30.25 | 21.97 | 46.19 | 29.65 | 27.25 | 27.25 | 27.25 | 27.25 | 27.25 |
| Depreciation | 124.4 | 106.7 | 100.1 | 88.9 | 90.0 | 81.5 | 85.0 | 88.7 | 92.6 | 96.7 |
| Depreciation, % | 17.93 | 9.73 | 8.93 | 8.44 | 13.5 | 11.71 | 11.71 | 11.71 | 11.71 | 11.71 |
| EBIT | -67.4 | 225.1 | 146.4 | 397.5 | 107.7 | 108.2 | 112.9 | 117.9 | 123.0 | 128.4 |
| EBIT, % | -9.72 | 20.52 | 13.05 | 37.74 | 16.15 | 15.55 | 15.55 | 15.55 | 15.55 | 15.55 |
| Total Cash | 103.6 | 220.5 | 136.9 | 157.6 | 57.7 | 98.6 | 102.9 | 107.4 | 112.1 | 117.0 |
| Total Cash, percent | .0 | .0 | .0 | .0 | .0 | .0 | .0 | .0 | .0 | .0 |
| Account Receivables | 13.7 | 18.7 | 20.5 | 17.0 | 13.2 | 12.7 | 13.2 | 13.8 | 14.4 | 15.0 |
| Account Receivables, % | 1.97 | 1.71 | 1.83 | 1.61 | 1.98 | 1.82 | 1.82 | 1.82 | 1.82 | 1.82 |
| Inventories | 5.6 | 6.6 | 8.1 | 8.1 | 8.0 | 5.7 | 6.0 | 6.2 | 6.5 | 6.8 |
| Inventories, % | 0.81235 | 0.60527 | 0.72362 | 0.76884 | 1.2 | 0.8222 | 0.8222 | 0.8222 | 0.8222 | 0.8222 |
| Accounts Payable | 20.2 | 19.1 | 25.2 | 18.7 | 21.7 | 16.6 | 17.3 | 18.1 | 18.9 | 19.7 |
| Accounts Payable, % | 2.91 | 1.74 | 2.24 | 1.78 | 3.25 | 2.38 | 2.38 | 2.38 | 2.38 | 2.38 |
| Capital Expenditure | -36.5 | -29.3 | -51.4 | -85.9 | -49.9 | -39.2 | -40.9 | -42.7 | -44.5 | -46.5 |
| Capital Expenditure, % | -5.26 | -2.67 | -4.58 | -8.15 | -7.48 | -5.63 | -5.63 | -5.63 | -5.63 | -5.63 |
| Tax Rate, % | 30.31 | 30.31 | 30.31 | 30.31 | 30.31 | 30.31 | 30.31 | 30.31 | 30.31 | 30.31 |
| EBITAT | -67.5 | 224.5 | 145.4 | 306.2 | 75.0 | 96.5 | 100.7 | 105.1 | 109.7 | 114.5 |
| Depreciation | ||||||||||
| Changes in Account Receivables | ||||||||||
| Changes in Inventories | ||||||||||
| Changes in Accounts Payable | ||||||||||
| Capital Expenditure | ||||||||||
| UFCF | 21.3 | 294.8 | 197.0 | 306.4 | 122.0 | 136.5 | 144.8 | 151.1 | 157.7 | 164.6 |
| WACC, % | 9.71 | 9.7 | 9.69 | 9.05 | 8.83 | 9.4 | 9.4 | 9.4 | 9.4 | 9.4 |
| PV UFCF | ||||||||||
| SUM PV UFCF | 576.2 | |||||||||
| Long Term Growth Rate, % | 3.00 | |||||||||
| Free cash flow (T + 1) | 169 | |||||||||
| Terminal Value | 2,649 | |||||||||
| Present Terminal Value | 1,691 | |||||||||
| Enterprise Value | 2,267 | |||||||||
| Net Debt | 446 | |||||||||
| Equity Value | 1,821 | |||||||||
| Diluted Shares Outstanding, MM | 30 | |||||||||
| Equity Value Per Share | 61.30 |
What You Will Get
- Editable Excel Template: A fully customizable Excel-based DCF Calculator featuring pre-filled real GDEN financials.
- Real-World Data: Historical data and forward-looking estimates (as indicated in the yellow cells).
- Forecast Flexibility: Adjust forecast assumptions such as revenue growth, EBITDA %, and WACC.
- Automatic Calculations: Instantly visualize the effects of your inputs on Golden Entertainment’s valuation.
- Professional Tool: Designed for investors, CFOs, consultants, and financial analysts.
- User-Friendly Design: Organized for clarity and ease of use, complete with step-by-step instructions.
Key Features
- Real-Life GDEN Data: Pre-filled with Golden Entertainment’s historical financials and future projections.
- Fully Customizable Inputs: Modify revenue growth, margins, WACC, tax rates, and capital expenditures to fit your analysis.
- Dynamic Valuation Model: Instant updates to Net Present Value (NPV) and intrinsic value based on your customized inputs.
- Scenario Testing: Develop multiple forecast scenarios to explore various valuation results.
- User-Friendly Design: Intuitive and structured, suitable for both professionals and newcomers.
How It Works
- Step 1: Download the Excel file.
- Step 2: Review Golden Entertainment, Inc.'s pre-filled financial data and forecasts.
- Step 3: Modify critical inputs like revenue growth, WACC, and tax rates (highlighted cells).
- Step 4: Watch the DCF model update instantly as you tweak assumptions.
- Step 5: Analyze the outputs and use the results for investment decisions.
Why Choose This Calculator for Golden Entertainment, Inc. (GDEN)?
- User-Friendly Interface: Perfectly crafted for both novice and seasoned users.
- Customizable Inputs: Adjust parameters effortlessly to suit your financial analysis.
- Real-Time Valuation: Monitor immediate updates on Golden Entertainment's valuation as you tweak inputs.
- Preloaded Financials: Comes equipped with Golden Entertainment’s actual financial metrics for swift evaluations.
- Preferred by Experts: Widely utilized by investors and analysts for making well-informed choices.
Who Should Use This Product?
- Investors: Evaluate Golden Entertainment's valuation prior to making stock transactions.
- CFOs and Financial Analysts: Enhance valuation workflows and assess financial forecasts.
- Startup Founders: Understand the valuation methods applied to established companies like Golden Entertainment.
- Consultants: Create detailed valuation reports for clients in the gaming and entertainment sector.
- Students and Educators: Utilize real-time data to practice and instruct on valuation strategies.
What the Template Contains
- Pre-Filled DCF Model: Golden Entertainment, Inc.'s (GDEN) financial data preloaded for immediate use.
- WACC Calculator: Detailed calculations for Weighted Average Cost of Capital specific to GDEN.
- Financial Ratios: Evaluate Golden Entertainment's profitability, leverage, and efficiency metrics.
- Editable Inputs: Change assumptions such as growth, margins, and CAPEX to fit your scenarios for GDEN.
- Financial Statements: Annual and quarterly reports to support detailed analysis of Golden Entertainment.
- Interactive Dashboard: Easily visualize key valuation metrics and results for GDEN.
Disclaimer
All information, articles, and product details provided on this website are for general informational and educational purposes only. We do not claim any ownership over, nor do we intend to infringe upon, any trademarks, copyrights, logos, brand names, or other intellectual property mentioned or depicted on this site. Such intellectual property remains the property of its respective owners, and any references here are made solely for identification or informational purposes, without implying any affiliation, endorsement, or partnership.
We make no representations or warranties, express or implied, regarding the accuracy, completeness, or suitability of any content or products presented. Nothing on this website should be construed as legal, tax, investment, financial, medical, or other professional advice. In addition, no part of this site—including articles or product references—constitutes a solicitation, recommendation, endorsement, advertisement, or offer to buy or sell any securities, franchises, or other financial instruments, particularly in jurisdictions where such activity would be unlawful.
All content is of a general nature and may not address the specific circumstances of any individual or entity. It is not a substitute for professional advice or services. Any actions you take based on the information provided here are strictly at your own risk. You accept full responsibility for any decisions or outcomes arising from your use of this website and agree to release us from any liability in connection with your use of, or reliance upon, the content or products found herein.