
|
Valoración DCF de Gevo, Inc. (GEVO) |
Completamente Editable: Adáptelo A Sus Necesidades En Excel O Sheets
Diseño Profesional: Plantillas Confiables Y Estándares De La Industria
Predeterminadas Para Un Uso Rápido Y Eficiente
Compatible con MAC / PC, completamente desbloqueado
No Se Necesita Experiencia; Fáciles De Seguir
Gevo, Inc. (GEVO) Bundle
¡Evalúe las perspectivas financieras de Gevo, Inc. (GEVO) como un experto! Esta calculadora DCF (GEVO) proporciona datos financieros preconsados y la libertad completa para modificar el crecimiento de los ingresos, WACC, los márgenes y otros supuestos esenciales para alinearse con sus proyecciones.
What You Will Get
- Pre-Filled Financial Model: Gevo, Inc.’s (GEVO) actual data enables precise DCF valuation.
- Full Forecast Control: Adjust revenue growth, margins, WACC, and other key drivers.
- Instant Calculations: Automatic updates ensure you see results as you make changes.
- Investor-Ready Template: A refined Excel file designed for professional-grade valuation.
- Customizable and Reusable: Tailored for flexibility, allowing repeated use for detailed forecasts.
Key Features
- Comprehensive DCF Calculator: Features in-depth unlevered and levered DCF valuation models tailored for Gevo, Inc. (GEVO).
- WACC Calculator: User-friendly Weighted Average Cost of Capital sheet with adjustable inputs specific to Gevo, Inc. (GEVO).
- Customizable Forecast Assumptions: Adjust growth rates, capital expenditures, and discount rates relevant to Gevo, Inc. (GEVO).
- Integrated Financial Ratios: Evaluate profitability, leverage, and efficiency ratios for Gevo, Inc. (GEVO).
- Interactive Dashboard and Charts: Visual representations summarize essential valuation metrics for straightforward analysis of Gevo, Inc. (GEVO).
How It Works
- 1. Open the Template: Download and open the Excel file containing Gevo, Inc.'s (GEVO) preloaded data.
- 2. Edit Assumptions: Modify key inputs such as growth rates, WACC, and capital expenditures.
- 3. View Results Instantly: The DCF model automatically calculates intrinsic value and NPV.
- 4. Test Scenarios: Analyze different valuation outcomes by comparing multiple forecasts.
- 5. Use with Confidence: Present professional valuation insights to reinforce your investment decisions.
Why Choose Gevo, Inc. (GEVO)?
- Innovative Solutions: Pioneering sustainable alternatives to fossil fuels and chemicals.
- Environmental Impact: Commitment to reducing carbon emissions through renewable resources.
- Industry Expertise: Backed by a team with extensive experience in renewable energy and biotechnology.
- Scalable Technology: Flexible processes that can be adapted for various applications and markets.
- Future-Focused: Strategic vision aimed at leading the transition to a sustainable economy.
Who Should Use This Product?
- Environmental Science Students: Explore sustainable energy solutions and apply theoretical concepts to real-world scenarios.
- Researchers: Integrate advanced biofuel models into academic studies or publications.
- Investors: Evaluate your investment strategies and assess valuation metrics for Gevo, Inc. (GEVO).
- Market Analysts: Enhance your analysis with a customizable financial model tailored for renewable energy companies.
- Entrepreneurs: Understand how innovative companies like Gevo, Inc. (GEVO) are positioned in the market.
What the Template Contains
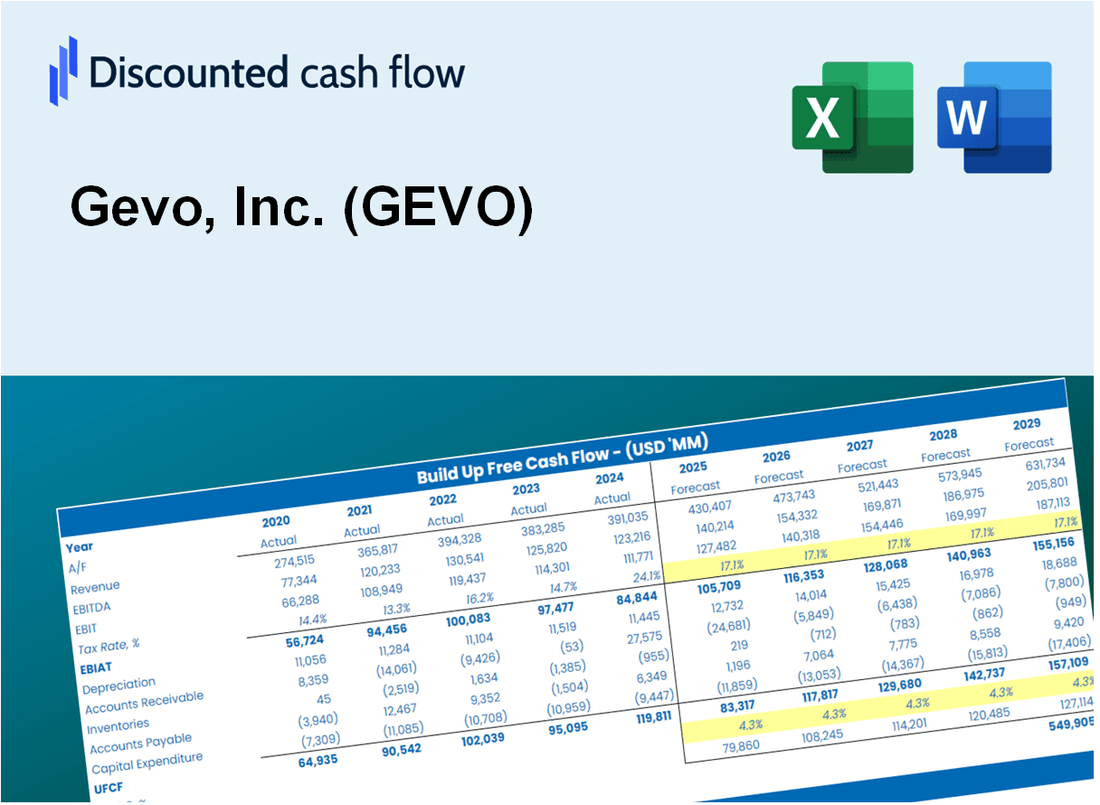
- Operating and Balance Sheet Data: Pre-filled Gevo, Inc. (GEVO) historical data and forecasts, including revenue, EBITDA, EBIT, and capital expenditures.
- WACC Calculation: A dedicated sheet for Weighted Average Cost of Capital (WACC), featuring parameters such as Beta, risk-free rate, and share price.
- DCF Valuation (Unlevered and Levered): Editable Discounted Cash Flow models illustrating intrinsic value with comprehensive calculations.
- Financial Statements: Pre-loaded financial statements (annual and quarterly) to facilitate thorough analysis.
- Key Ratios: Includes profitability, leverage, and efficiency ratios specific to Gevo, Inc. (GEVO).
- Dashboard and Charts: Visual summary of valuation outputs and assumptions for easy analysis of results.
Disclaimer
All information, articles, and product details provided on this website are for general informational and educational purposes only. We do not claim any ownership over, nor do we intend to infringe upon, any trademarks, copyrights, logos, brand names, or other intellectual property mentioned or depicted on this site. Such intellectual property remains the property of its respective owners, and any references here are made solely for identification or informational purposes, without implying any affiliation, endorsement, or partnership.
We make no representations or warranties, express or implied, regarding the accuracy, completeness, or suitability of any content or products presented. Nothing on this website should be construed as legal, tax, investment, financial, medical, or other professional advice. In addition, no part of this site—including articles or product references—constitutes a solicitation, recommendation, endorsement, advertisement, or offer to buy or sell any securities, franchises, or other financial instruments, particularly in jurisdictions where such activity would be unlawful.
All content is of a general nature and may not address the specific circumstances of any individual or entity. It is not a substitute for professional advice or services. Any actions you take based on the information provided here are strictly at your own risk. You accept full responsibility for any decisions or outcomes arising from your use of this website and agree to release us from any liability in connection with your use of, or reliance upon, the content or products found herein.