
|
Grafton Group Plc (GFTU.L) Valoración de DCF |
Completamente Editable: Adáptelo A Sus Necesidades En Excel O Sheets
Diseño Profesional: Plantillas Confiables Y Estándares De La Industria
Predeterminadas Para Un Uso Rápido Y Eficiente
Compatible con MAC / PC, completamente desbloqueado
No Se Necesita Experiencia; Fáciles De Seguir
Grafton Group plc (GFTU.L) Bundle
¡Explore las perspectivas financieras de Grafton Group PLC (GFTUL) con nuestra calculadora DCF fácil de usar! Ingrese sus proyecciones para el crecimiento, los márgenes y los gastos para determinar el valor intrínseco de Grafton Group PLC (GFTUL) y refinar su enfoque de inversión.
What You Will Receive
- Customizable Excel Template: A fully adaptable Excel-based DCF Calculator featuring pre-filled financial data for Grafton Group plc (GFTUL).
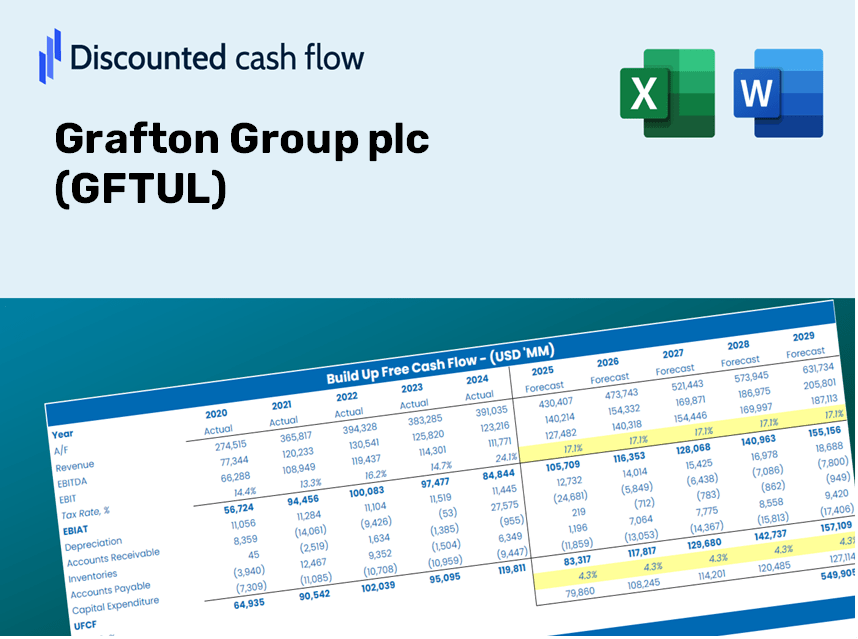
- Comprehensive Data: Historical performance metrics and future projections (highlighted in the yellow cells).
- Flexible Forecasting: Adjust key assumptions such as revenue growth, EBITDA percentage, and WACC.
- Instant Calculations: Immediately observe how your variables affect Grafton Group plc's (GFTUL) valuation.
- Professional Resource: Designed for investors, CFOs, consultants, and financial analysts.
- User-Friendly Layout: Organized for straightforward navigation and ease of use, complete with step-by-step guidance.
Key Features
- Advanced DCF Calculator: Features comprehensive unlevered and levered DCF valuation models tailored for Grafton Group plc (GFTUL).
- WACC Calculator: A user-friendly Weighted Average Cost of Capital sheet with adjustable inputs specific to Grafton Group plc (GFTUL).
- Editable Forecast Assumptions: Easily adjust growth rates, capital expenditures, and discount rates for accurate forecasting.
- Built-In Financial Ratios: Evaluate key profitability, leverage, and efficiency ratios for Grafton Group plc (GFTUL).
- Dashboard and Charts: Visual representations provide a clear summary of essential valuation metrics for straightforward analysis.
How It Works
- Step 1: Download the Excel file.
- Step 2: Review the pre-populated Grafton Group plc (GFTUL) data (historical and projected).
- Step 3: Modify the key assumptions (highlighted in yellow) according to your analysis.
- Step 4: Observe the automatic recalculations for Grafton Group plc's intrinsic value.
- Step 5: Utilize the results for your investment strategies or reporting purposes.
Why Use the Grafton Group plc Calculator?
- All-in-One Solution: Combines DCF, WACC, and financial ratio analyses for thorough evaluations.
- Flexible Inputs: Modify the yellow-highlighted fields to explore different financial scenarios.
- In-Depth Analysis: Automatically computes the intrinsic value and Net Present Value for Grafton Group plc (GFTUL).
- Ready-to-Use Data: Features historical and projected data to provide reliable starting points.
- Top-Tier Quality: Perfect for financial analysts, investors, and business consultants focusing on Grafton Group plc (GFTUL).
Who Can Benefit from This Product?
- Investors: Evaluate Grafton Group plc's (GFTUL) valuation prior to making buy or sell decisions.
- CFOs and Financial Analysts: Optimize valuation workflows and assess financial forecasts.
- Startup Founders: Understand how large publicly traded firms like Grafton Group plc (GFTUL) are appraised.
- Consultants: Prepare comprehensive valuation reports for your clients.
- Students and Educators: Utilize real-world examples to learn and teach valuation methods.
Contents of the Template
- Detailed DCF Model: An editable template featuring comprehensive valuation calculations.
- Historical Data: Grafton Group plc’s (GFTUL) past and projected financials already incorporated for thorough analysis.
- Adjustable Variables: Modify WACC, growth rates, and tax assumptions to explore different scenarios.
- Financial Statements: Complete annual and quarterly reports for enhanced insights.
- Essential Ratios: Integrated analysis for assessing profitability, efficiency, and leverage.
- Visual Dashboard: Charts and tables presenting clear, actionable results.
Disclaimer
All information, articles, and product details provided on this website are for general informational and educational purposes only. We do not claim any ownership over, nor do we intend to infringe upon, any trademarks, copyrights, logos, brand names, or other intellectual property mentioned or depicted on this site. Such intellectual property remains the property of its respective owners, and any references here are made solely for identification or informational purposes, without implying any affiliation, endorsement, or partnership.
We make no representations or warranties, express or implied, regarding the accuracy, completeness, or suitability of any content or products presented. Nothing on this website should be construed as legal, tax, investment, financial, medical, or other professional advice. In addition, no part of this site—including articles or product references—constitutes a solicitation, recommendation, endorsement, advertisement, or offer to buy or sell any securities, franchises, or other financial instruments, particularly in jurisdictions where such activity would be unlawful.
All content is of a general nature and may not address the specific circumstances of any individual or entity. It is not a substitute for professional advice or services. Any actions you take based on the information provided here are strictly at your own risk. You accept full responsibility for any decisions or outcomes arising from your use of this website and agree to release us from any liability in connection with your use of, or reliance upon, the content or products found herein.