
|
Valoración DCF de Gulf Island Fabrication, Inc. (GIFI) |
Completamente Editable: Adáptelo A Sus Necesidades En Excel O Sheets
Diseño Profesional: Plantillas Confiables Y Estándares De La Industria
Predeterminadas Para Un Uso Rápido Y Eficiente
Compatible con MAC / PC, completamente desbloqueado
No Se Necesita Experiencia; Fáciles De Seguir
Gulf Island Fabrication, Inc. (GIFI) Bundle
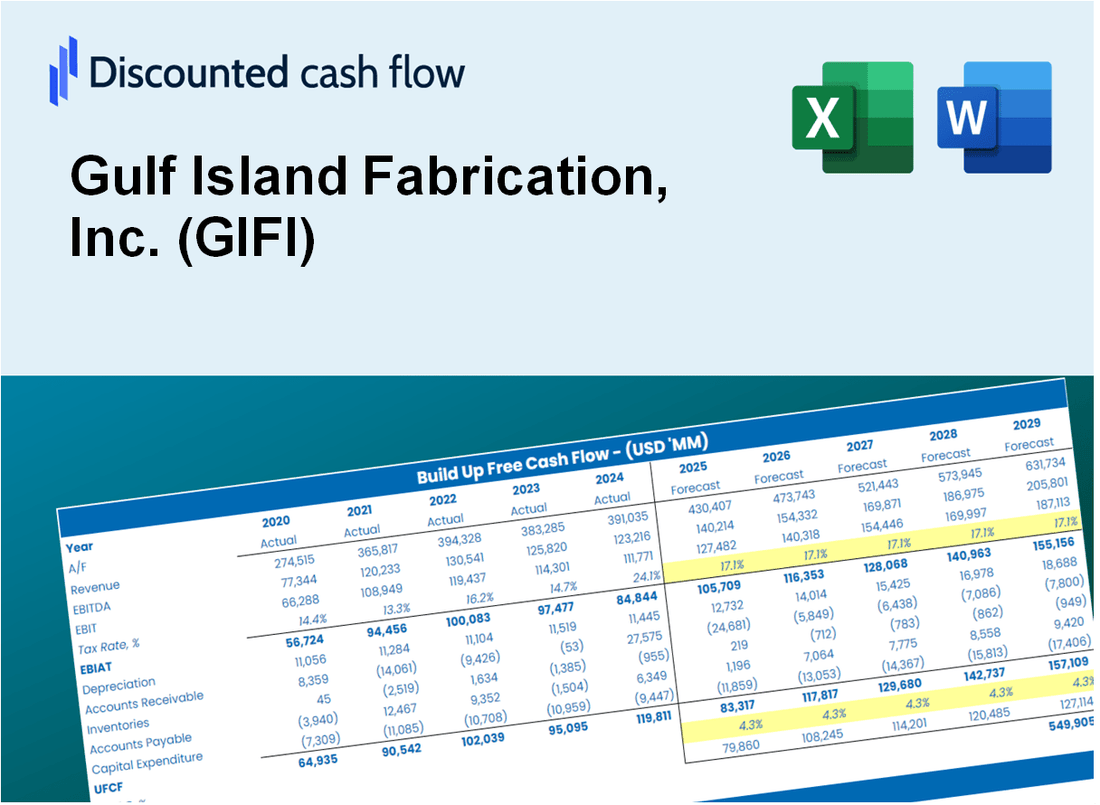
¡Obtenga información sobre su análisis de valoración de Gulf Island Fabrication, Inc. (GIFI) utilizando nuestra sofisticada calculadora DCF! Prelabastado con datos reales (GIFI), esta plantilla de Excel le permite ajustar preventos y supuestos para determinar con precisión el valor intrínseco de Gulf Island Fabrication, Inc. (GIFI).
Discounted Cash Flow (DCF) - (USD MM)
| Year | AY1 2020 |
AY2 2021 |
AY3 2022 |
AY4 2023 |
AY5 2024 |
FY1 2025 |
FY2 2026 |
FY3 2027 |
FY4 2028 |
FY5 2029 |
|---|---|---|---|---|---|---|---|---|---|---|
| Revenue | 117.7 | 93.5 | 142.3 | 151.1 | 159.2 | 176.4 | 195.4 | 216.6 | 239.9 | 265.9 |
| Revenue Growth, % | 0 | -20.62 | 52.29 | 6.15 | 5.38 | 10.8 | 10.8 | 10.8 | 10.8 | 10.8 |
| EBITDA | -12.0 | -3.8 | -5.5 | -22.7 | 14.0 | -8.6 | -9.5 | -10.5 | -11.7 | -12.9 |
| EBITDA, % | -10.19 | -4.06 | -3.88 | -15.04 | 8.82 | -4.87 | -4.87 | -4.87 | -4.87 | -4.87 |
| Depreciation | 8.6 | 5.4 | 4.8 | 5.5 | 4.9 | 8.2 | 9.0 | 10.0 | 11.1 | 12.3 |
| Depreciation, % | 7.32 | 5.76 | 3.37 | 3.62 | 3.06 | 4.63 | 4.63 | 4.63 | 4.63 | 4.63 |
| EBIT | -20.6 | -9.2 | -10.3 | -28.2 | 9.2 | -16.7 | -18.6 | -20.6 | -22.8 | -25.2 |
| EBIT, % | -17.51 | -9.83 | -7.25 | -18.65 | 5.77 | -9.49 | -9.49 | -9.49 | -9.49 | -9.49 |
| Total Cash | 51.2 | 52.9 | 43.1 | 46.4 | 66.1 | 71.5 | 79.2 | 87.7 | 97.2 | 107.7 |
| Total Cash, percent | .0 | .0 | .0 | .0 | .0 | .0 | .0 | .0 | .0 | .0 |
| Account Receivables | 19.2 | 20.7 | 34.3 | 39.0 | 31.1 | 38.1 | 42.2 | 46.8 | 51.8 | 57.4 |
| Account Receivables, % | 16.3 | 22.2 | 24.08 | 25.84 | 19.53 | 21.59 | 21.59 | 21.59 | 21.59 | 21.59 |
| Inventories | 2.2 | 1.8 | 1.6 | 2.1 | 1.9 | 2.6 | 2.9 | 3.2 | 3.6 | 3.9 |
| Inventories, % | 1.83 | 1.9 | 1.12 | 1.37 | 1.2 | 1.49 | 1.49 | 1.49 | 1.49 | 1.49 |
| Accounts Payable | 12.4 | 9.3 | 8.3 | 8.5 | 5.8 | 12.5 | 13.9 | 15.4 | 17.0 | 18.9 |
| Accounts Payable, % | 10.5 | 9.93 | 5.84 | 5.6 | 3.64 | 7.1 | 7.1 | 7.1 | 7.1 | 7.1 |
| Capital Expenditure | -11.2 | -1.5 | -3.1 | -2.9 | -5.3 | -6.5 | -7.2 | -8.0 | -8.9 | -9.9 |
| Capital Expenditure, % | -9.52 | -1.59 | -2.17 | -1.9 | -3.36 | -3.71 | -3.71 | -3.71 | -3.71 | -3.71 |
| Tax Rate, % | -0.34717 | -0.34717 | -0.34717 | -0.34717 | -0.34717 | -0.34717 | -0.34717 | -0.34717 | -0.34717 | -0.34717 |
| EBITAT | -39.9 | -42.2 | -10.4 | -28.1 | 9.2 | -16.7 | -18.6 | -20.6 | -22.8 | -25.2 |
| Depreciation | ||||||||||
| Changes in Account Receivables | ||||||||||
| Changes in Inventories | ||||||||||
| Changes in Accounts Payable | ||||||||||
| Capital Expenditure | ||||||||||
| UFCF | -51.5 | -42.6 | -23.0 | -30.6 | 14.2 | -16.1 | -19.8 | -21.9 | -24.3 | -26.9 |
| WACC, % | 5.64 | 5.64 | 5.64 | 5.64 | 5.64 | 5.64 | 5.64 | 5.64 | 5.64 | 5.64 |
| PV UFCF | ||||||||||
| SUM PV UFCF | -91.6 | |||||||||
| Long Term Growth Rate, % | 2.00 | |||||||||
| Free cash flow (T + 1) | -27 | |||||||||
| Terminal Value | -755 | |||||||||
| Present Terminal Value | -574 | |||||||||
| Enterprise Value | -665 | |||||||||
| Net Debt | -8 | |||||||||
| Equity Value | -657 | |||||||||
| Diluted Shares Outstanding, MM | 17 | |||||||||
| Equity Value Per Share | -39.22 |
What You Will Get
- Real GIFI Data: Preloaded financials – from revenue to EBIT – based on actual and projected figures.
- Full Customization: Adjust all critical parameters (yellow cells) like WACC, growth %, and tax rates.
- Instant Valuation Updates: Automatic recalculations to analyze the impact of changes on Gulf Island Fabrication, Inc.'s (GIFI) fair value.
- Versatile Excel Template: Tailored for quick edits, scenario testing, and detailed projections.
- Time-Saving and Accurate: Skip building models from scratch while maintaining precision and flexibility.
Key Features
- Accurate Financial Data: Access reliable pre-loaded historical performance and future forecasts for Gulf Island Fabrication, Inc. (GIFI).
- Adjustable Forecast Parameters: Modify highlighted fields such as WACC, growth rates, and profit margins to suit your analysis.
- Real-Time Calculations: Automatic recalculations for DCF, Net Present Value (NPV), and cash flow assessments.
- User-Friendly Dashboard: Intuitive charts and summaries designed to help you visualize valuation outcomes effectively.
- Suitable for All Skill Levels: An accessible layout crafted for investors, CFOs, and consultants alike.
How It Works
- 1. Access the Template: Download and open the Excel file containing Gulf Island Fabrication, Inc. (GIFI)’s preloaded data.
- 2. Adjust Assumptions: Modify essential inputs such as growth rates, WACC, and capital expenditures.
- 3. View Results Instantly: The DCF model automatically calculates intrinsic value and NPV in real-time.
- 4. Explore Scenarios: Analyze various forecasts to evaluate different valuation outcomes.
- 5. Present with Assurance: Deliver professional valuation insights to enhance your decision-making process.
Why Choose This Calculator for Gulf Island Fabrication, Inc. (GIFI)?
- User-Friendly Interface: Perfectly designed for both novices and seasoned professionals.
- Customizable Inputs: Easily adjust parameters to suit your specific analysis needs.
- Real-Time Valuation: Instantly see how changes affect Gulf Island Fabrication’s valuation.
- Pre-Configured Data: Comes with Gulf Island Fabrication’s latest financial information for swift evaluations.
- Relied Upon by Experts: A go-to tool for investors and analysts seeking to make well-informed choices.
Who Should Use This Product?
- Engineering Students: Explore fabrication techniques and apply them using real-world examples.
- Researchers: Integrate industry-specific models into academic studies or projects.
- Investors: Validate your strategies and evaluate valuation metrics for Gulf Island Fabrication, Inc. (GIFI).
- Industry Analysts: Enhance your analysis with a customizable financial model tailored for the fabrication sector.
- Entrepreneurs: Understand how companies like Gulf Island Fabrication, Inc. (GIFI) are assessed in the market.
What the Template Contains
- Preloaded GIFI Data: Historical and projected financial data, including revenue, EBIT, and capital expenditures.
- DCF and WACC Models: Professional-grade sheets for calculating intrinsic value and Weighted Average Cost of Capital.
- Editable Inputs: Yellow-highlighted cells for adjusting revenue growth, tax rates, and discount rates.
- Financial Statements: Comprehensive annual and quarterly financials for deeper analysis.
- Key Ratios: Profitability, leverage, and efficiency ratios to evaluate performance.
- Dashboard and Charts: Visual summaries of valuation outcomes and assumptions.
Disclaimer
All information, articles, and product details provided on this website are for general informational and educational purposes only. We do not claim any ownership over, nor do we intend to infringe upon, any trademarks, copyrights, logos, brand names, or other intellectual property mentioned or depicted on this site. Such intellectual property remains the property of its respective owners, and any references here are made solely for identification or informational purposes, without implying any affiliation, endorsement, or partnership.
We make no representations or warranties, express or implied, regarding the accuracy, completeness, or suitability of any content or products presented. Nothing on this website should be construed as legal, tax, investment, financial, medical, or other professional advice. In addition, no part of this site—including articles or product references—constitutes a solicitation, recommendation, endorsement, advertisement, or offer to buy or sell any securities, franchises, or other financial instruments, particularly in jurisdictions where such activity would be unlawful.
All content is of a general nature and may not address the specific circumstances of any individual or entity. It is not a substitute for professional advice or services. Any actions you take based on the information provided here are strictly at your own risk. You accept full responsibility for any decisions or outcomes arising from your use of this website and agree to release us from any liability in connection with your use of, or reliance upon, the content or products found herein.