
|
GlaxoSmithKline Pharmaceuticals Limited (Glaxo.NS) DCF Valoración |
Completamente Editable: Adáptelo A Sus Necesidades En Excel O Sheets
Diseño Profesional: Plantillas Confiables Y Estándares De La Industria
Predeterminadas Para Un Uso Rápido Y Eficiente
Compatible con MAC / PC, completamente desbloqueado
No Se Necesita Experiencia; Fáciles De Seguir
GlaxoSmithKline Pharmaceuticals Limited (GLAXO.NS) Bundle
¡Mejore sus estrategias de inversión con la calculadora DCF (Glaxons)! Revise las finanzas genuinas de GlaxoSmithKline, ajuste las predicciones y gastos de crecimiento, y observe instantáneamente cómo estas alteraciones afectan el valor intrínseco de (Glaxons).
Discounted Cash Flow (DCF) - (USD MM)
| Year | AY1 2021 |
AY2 2022 |
AY3 2023 |
AY4 2024 |
AY5 2025 |
FY1 2026 |
FY2 2027 |
FY3 2028 |
FY4 2029 |
FY5 2030 |
|---|---|---|---|---|---|---|---|---|---|---|
| Revenue | 29,256.0 | 32,780.3 | 32,517.2 | 34,417.7 | 37,492.1 | 39,931.0 | 42,528.7 | 45,295.2 | 48,241.8 | 51,380.1 |
| Revenue Growth, % | 0 | 12.05 | -0.80259 | 5.84 | 8.93 | 6.51 | 6.51 | 6.51 | 6.51 | 6.51 |
| EBITDA | 5,356.3 | 8,488.3 | 9,034.2 | 8,873.0 | 11,773.6 | 10,315.7 | 10,986.8 | 11,701.5 | 12,462.7 | 13,273.4 |
| EBITDA, % | 18.31 | 25.89 | 27.78 | 25.78 | 31.4 | 25.83 | 25.83 | 25.83 | 25.83 | 25.83 |
| Depreciation | 784.6 | 680.4 | 656.2 | 695.4 | 667.9 | 844.7 | 899.7 | 958.2 | 1,020.6 | 1,086.9 |
| Depreciation, % | 2.68 | 2.08 | 2.02 | 2.02 | 1.78 | 2.12 | 2.12 | 2.12 | 2.12 | 2.12 |
| EBIT | 4,571.7 | 7,807.9 | 8,378.0 | 8,177.6 | 11,105.7 | 9,471.0 | 10,087.1 | 10,743.3 | 11,442.1 | 12,186.5 |
| EBIT, % | 15.63 | 23.82 | 25.76 | 23.76 | 29.62 | 23.72 | 23.72 | 23.72 | 23.72 | 23.72 |
| Total Cash | 11,629.1 | 29,027.3 | 16,541.2 | 18,568.2 | 24,981.0 | 23,938.6 | 25,495.9 | 27,154.4 | 28,920.9 | 30,802.2 |
| Total Cash, percent | .0 | .0 | .0 | .0 | .0 | .0 | .0 | .0 | .0 | .0 |
| Account Receivables | 2,413.2 | 2,052.4 | 3,300.3 | 3,499.1 | 3,608.3 | 3,549.9 | 3,780.8 | 4,026.7 | 4,288.7 | 4,567.7 |
| Account Receivables, % | 8.25 | 6.26 | 10.15 | 10.17 | 9.62 | 8.89 | 8.89 | 8.89 | 8.89 | 8.89 |
| Inventories | 5,467.0 | 5,347.0 | 4,599.7 | 5,250.5 | 4,817.4 | 6,169.2 | 6,570.5 | 6,997.9 | 7,453.2 | 7,938.0 |
| Inventories, % | 18.69 | 16.31 | 14.15 | 15.26 | 12.85 | 15.45 | 15.45 | 15.45 | 15.45 | 15.45 |
| Accounts Payable | 4,661.3 | 5,793.3 | 4,277.9 | 6,254.1 | 7,082.6 | 6,694.3 | 7,129.8 | 7,593.6 | 8,087.6 | 8,613.7 |
| Accounts Payable, % | 15.93 | 17.67 | 13.16 | 18.17 | 18.89 | 16.76 | 16.76 | 16.76 | 16.76 | 16.76 |
| Capital Expenditure | -442.3 | -346.4 | -440.4 | -312.2 | -230.2 | -434.8 | -463.0 | -493.2 | -525.3 | -559.4 |
| Capital Expenditure, % | -1.51 | -1.06 | -1.35 | -0.90713 | -0.614 | -1.09 | -1.09 | -1.09 | -1.09 | -1.09 |
| Tax Rate, % | 26.38 | 26.38 | 26.38 | 26.38 | 26.38 | 26.38 | 26.38 | 26.38 | 26.38 | 26.38 |
| EBITAT | 3,606.6 | 16,985.0 | 6,117.1 | 5,911.0 | 8,176.5 | 7,535.3 | 8,025.5 | 8,547.5 | 9,103.6 | 9,695.8 |
| Depreciation | ||||||||||
| Changes in Account Receivables | ||||||||||
| Changes in Inventories | ||||||||||
| Changes in Accounts Payable | ||||||||||
| Capital Expenditure | ||||||||||
| UFCF | 730.0 | 18,931.8 | 4,316.9 | 7,420.7 | 9,766.6 | 6,263.6 | 8,265.3 | 8,803.0 | 9,375.7 | 9,985.6 |
| WACC, % | 4.67 | 4.67 | 4.67 | 4.67 | 4.67 | 4.67 | 4.67 | 4.67 | 4.67 | 4.67 |
| PV UFCF | ||||||||||
| SUM PV UFCF | 36,969.4 | |||||||||
| Long Term Growth Rate, % | 4.00 | |||||||||
| Free cash flow (T + 1) | 10,385 | |||||||||
| Terminal Value | 1,561,072 | |||||||||
| Present Terminal Value | 1,242,826 | |||||||||
| Enterprise Value | 1,279,796 | |||||||||
| Net Debt | -13,936 | |||||||||
| Equity Value | 1,293,731 | |||||||||
| Diluted Shares Outstanding, MM | 169 | |||||||||
| Equity Value Per Share | 7,637.59 |
What You Will Receive
- Customizable Excel Template: A fully editable DCF Calculator in Excel featuring pre-filled financial data for GLAXONS (GLAXONS).
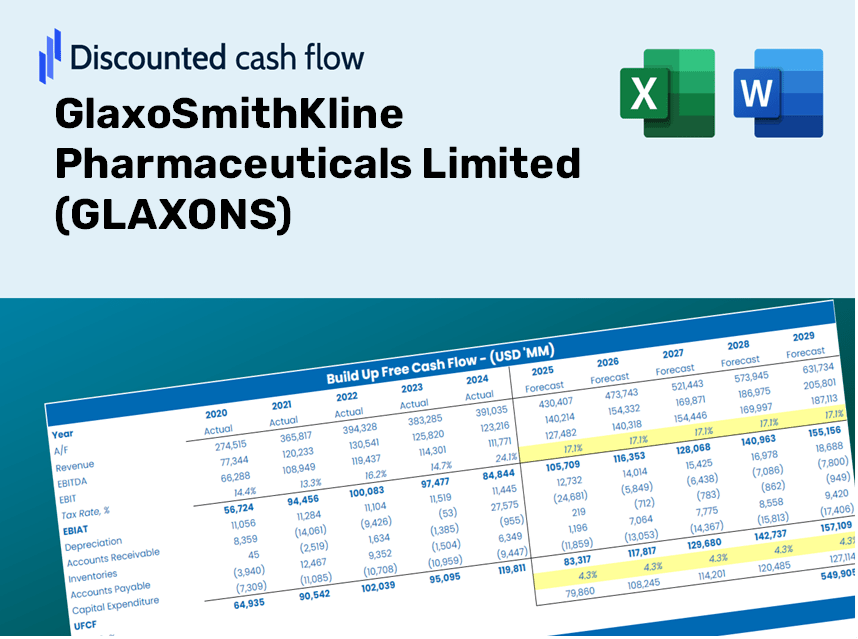
- Authentic Data: Access to historical figures and future projections (highlighted in the yellow cells).
- Assumption Flexibility: Adjust forecast parameters such as revenue growth, EBITDA %, and WACC.
- Instant Calculations: Quickly observe how your inputs affect the valuation of GlaxoSmithKline Pharmaceuticals Limited.
- Professional Resource: Designed with investors, CFOs, consultants, and financial analysts in mind.
- User-Centric Layout: Organized for straightforward navigation, complete with step-by-step guidance.
Key Features
- Customizable Forecast Inputs: Adjust essential variables such as sales growth, operating profit margin, and R&D expenditures.
- Instant DCF Valuation: Provides immediate calculations for intrinsic value, net present value (NPV), and other key metrics.
- High-Precision Accuracy: Leverages GlaxoSmithKline's (GLAXONS) actual financial data for reliable valuation results.
- Effortless Scenario Analysis: Easily evaluate various assumptions and analyze different outcomes in a streamlined manner.
- Efficiency Boosting Tool: Remove the hassle of developing intricate valuation models from the ground up.
How It Functions
- Download the Template: Gain immediate access to the Excel-based GLAXONS DCF Calculator.
- Input Your Assumptions: Modify the yellow-highlighted cells for growth rates, WACC, profit margins, and more.
- Instant Calculations: The model automatically updates the intrinsic value of GlaxoSmithKline Pharmaceuticals.
- Test Scenarios: Experiment with different assumptions to assess potential changes in valuation.
- Analyze and Decide: Utilize the results to inform your investment or financial analysis.
Why Select This Calculator?
- Designed for Experts: A sophisticated tool utilized by finance professionals, analysts, and consultants.
- Accurate Financial Data: Preloaded historical and projected financials for GlaxoSmithKline Pharmaceuticals Limited (GLAXONS) ensure precision.
- Flexible Scenario Analysis: Easily model various forecasts and assumptions.
- Clear Results: Automatically determines intrinsic value, NPV, and essential metrics.
- User-Friendly: Comprehensive step-by-step guidance to facilitate the process.
Who Should Benefit from This Product?
- Healthcare Investors: Develop comprehensive and accurate valuation models for portfolio assessment related to GlaxoSmithKline Pharmaceuticals Limited (GLAXONS).
- Corporate Finance Teams: Evaluate valuation scenarios to inform strategic decisions within the organization.
- Consultants and Advisors: Equip clients with precise valuation insights for GlaxoSmithKline Pharmaceuticals Limited (GLAXONS) stock.
- Students and Educators: Utilize real-world data to enhance learning and practice in financial modeling.
- Pharmaceutical Enthusiasts: Gain a deeper understanding of how companies like GlaxoSmithKline Pharmaceuticals Limited (GLAXONS) are valued in the marketplace.
What the Template Includes
- Pre-Filled DCF Model: GlaxoSmithKline’s (GLAXONS) financial data preloaded for immediate application.
- WACC Calculator: Comprehensive calculations for Weighted Average Cost of Capital.
- Financial Ratios: Assess GlaxoSmithKline’s (GLAXONS) profitability, leverage, and operational efficiency.
- Editable Inputs: Modify assumptions like growth rates, profit margins, and capital expenditures to suit your scenarios.
- Financial Statements: Annual and quarterly reports to enable in-depth analysis.
- Interactive Dashboard: Effortlessly visualize essential valuation metrics and outcomes.
Disclaimer
All information, articles, and product details provided on this website are for general informational and educational purposes only. We do not claim any ownership over, nor do we intend to infringe upon, any trademarks, copyrights, logos, brand names, or other intellectual property mentioned or depicted on this site. Such intellectual property remains the property of its respective owners, and any references here are made solely for identification or informational purposes, without implying any affiliation, endorsement, or partnership.
We make no representations or warranties, express or implied, regarding the accuracy, completeness, or suitability of any content or products presented. Nothing on this website should be construed as legal, tax, investment, financial, medical, or other professional advice. In addition, no part of this site—including articles or product references—constitutes a solicitation, recommendation, endorsement, advertisement, or offer to buy or sell any securities, franchises, or other financial instruments, particularly in jurisdictions where such activity would be unlawful.
All content is of a general nature and may not address the specific circumstances of any individual or entity. It is not a substitute for professional advice or services. Any actions you take based on the information provided here are strictly at your own risk. You accept full responsibility for any decisions or outcomes arising from your use of this website and agree to release us from any liability in connection with your use of, or reliance upon, the content or products found herein.