
|
Valoración de DCF Glencore PLC (Glen.L) |
Completamente Editable: Adáptelo A Sus Necesidades En Excel O Sheets
Diseño Profesional: Plantillas Confiables Y Estándares De La Industria
Predeterminadas Para Un Uso Rápido Y Eficiente
Compatible con MAC / PC, completamente desbloqueado
No Se Necesita Experiencia; Fáciles De Seguir
Glencore plc (GLEN.L) Bundle
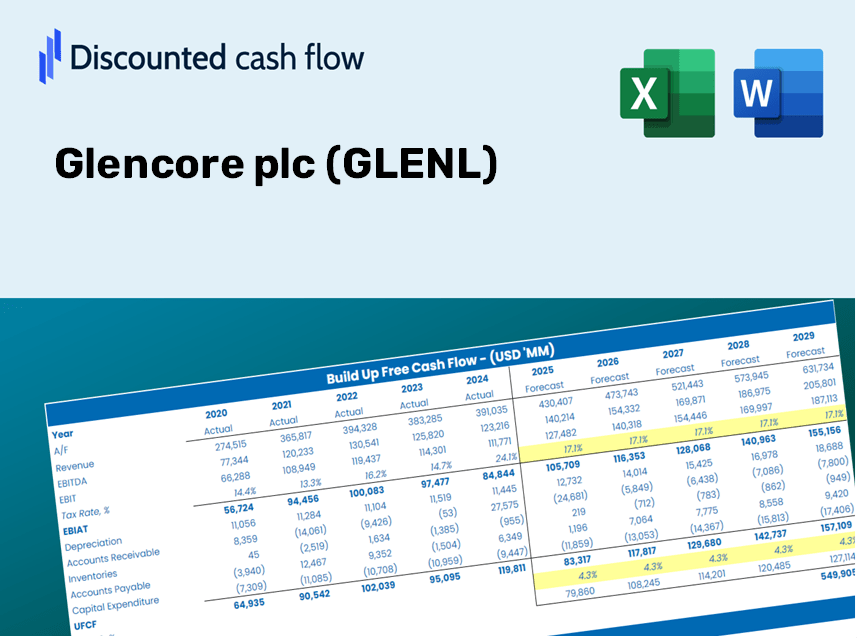
¡Obtenga información sobre su análisis de valoración de Glencore PLC (GLENL) utilizando nuestra sofisticada calculadora DCF! Esta plantilla de Excel viene precargada con datos reales (Glenl), lo que le permite ajustar los pronósticos y supuestos para determinar con precisión el valor intrínseco de Glencore PLC.
Discounted Cash Flow (DCF) - (USD MM)
| Year | AY1 2020 |
AY2 2021 |
AY3 2022 |
AY4 2023 |
AY5 2024 |
FY1 2025 |
FY2 2026 |
FY3 2027 |
FY4 2028 |
FY5 2029 |
|---|---|---|---|---|---|---|---|---|---|---|
| Revenue | 106,598.7 | 152,591.6 | 191,709.5 | 163,134.8 | 172,956.8 | 198,855.8 | 228,633.1 | 262,869.2 | 302,232.0 | 347,489.1 |
| Revenue Growth, % | 0 | 43.15 | 25.64 | -14.91 | 6.02 | 14.97 | 14.97 | 14.97 | 14.97 | 14.97 |
| EBITDA | 2,342.6 | 12,004.3 | 24,134.4 | 11,472.6 | 7,375.3 | 13,502.5 | 15,524.4 | 17,849.0 | 20,521.8 | 23,594.8 |
| EBITDA, % | 2.2 | 7.87 | 12.59 | 7.03 | 4.26 | 6.79 | 6.79 | 6.79 | 6.79 | 6.79 |
| Depreciation | 4,996.0 | 4,744.4 | 5,232.6 | 4,957.8 | 4,879.9 | 6,516.9 | 7,492.7 | 8,614.7 | 9,904.7 | 11,387.9 |
| Depreciation, % | 4.69 | 3.11 | 2.73 | 3.04 | 2.82 | 3.28 | 3.28 | 3.28 | 3.28 | 3.28 |
| EBIT | -2,653.4 | 7,260.0 | 18,901.8 | 6,514.8 | 2,495.4 | 6,985.6 | 8,031.6 | 9,234.3 | 10,617.1 | 12,206.9 |
| EBIT, % | -2.49 | 4.76 | 9.86 | 3.99 | 1.44 | 3.51 | 3.51 | 3.51 | 3.51 | 3.51 |
| Total Cash | 1,060.5 | 2,017.6 | 1,477.6 | 1,457.4 | 1,622.9 | 1,956.5 | 2,249.5 | 2,586.3 | 2,973.6 | 3,418.9 |
| Total Cash, percent | .0 | .0 | .0 | .0 | .0 | .0 | .0 | .0 | .0 | .0 |
| Account Receivables | 6,078.2 | 7,957.2 | 9,787.5 | 8,134.7 | 8,957.7 | 10,415.1 | 11,974.7 | 13,767.9 | 15,829.5 | 18,199.9 |
| Account Receivables, % | 5.7 | 5.21 | 5.11 | 4.99 | 5.18 | 5.24 | 5.24 | 5.24 | 5.24 | 5.24 |
| Inventories | 17,114.1 | 21,294.6 | 25,058.6 | 23,642.4 | 22,152.8 | 27,991.7 | 32,183.3 | 37,002.5 | 42,543.4 | 48,914.0 |
| Inventories, % | 16.05 | 13.96 | 13.07 | 14.49 | 12.81 | 14.08 | 14.08 | 14.08 | 14.08 | 14.08 |
| Accounts Payable | 7,549.0 | 8,628.2 | 5,817.6 | 4,239.6 | 18,626.9 | 11,589.0 | 13,324.4 | 15,319.6 | 17,613.7 | 20,251.2 |
| Accounts Payable, % | 7.08 | 5.65 | 3.03 | 2.6 | 10.77 | 5.83 | 5.83 | 5.83 | 5.83 | 5.83 |
| Capital Expenditure | -2,672.9 | -2,709.6 | -3,128.2 | -3,358.1 | -4,202.1 | -4,137.4 | -4,756.9 | -5,469.2 | -6,288.2 | -7,229.8 |
| Capital Expenditure, % | -2.51 | -1.78 | -1.63 | -2.06 | -2.43 | -2.08 | -2.08 | -2.08 | -2.08 | -2.08 |
| Tax Rate, % | -63.73 | -63.73 | -63.73 | -63.73 | -63.73 | -63.73 | -63.73 | -63.73 | -63.73 | -63.73 |
| EBITAT | -987.0 | 4,896.4 | 14,309.2 | 5,147.4 | 4,085.6 | 5,020.6 | 5,772.4 | 6,636.8 | 7,630.6 | 8,773.2 |
| Depreciation | ||||||||||
| Changes in Account Receivables | ||||||||||
| Changes in Inventories | ||||||||||
| Changes in Accounts Payable | ||||||||||
| Capital Expenditure | ||||||||||
| UFCF | -14,307.1 | 1,950.9 | 8,008.6 | 8,238.1 | 19,817.3 | -6,934.1 | 4,492.5 | 5,165.2 | 5,938.6 | 6,827.9 |
| WACC, % | 5.81 | 6.74 | 7 | 7.1 | 7.75 | 6.88 | 6.88 | 6.88 | 6.88 | 6.88 |
| PV UFCF | ||||||||||
| SUM PV UFCF | 11,120.8 | |||||||||
| Long Term Growth Rate, % | 1.00 | |||||||||
| Free cash flow (T + 1) | 6,896 | |||||||||
| Terminal Value | 117,239 | |||||||||
| Present Terminal Value | 84,052 | |||||||||
| Enterprise Value | 95,173 | |||||||||
| Net Debt | 26,916 | |||||||||
| Equity Value | 68,257 | |||||||||
| Diluted Shares Outstanding, MM | 12,154 | |||||||||
| Equity Value Per Share | 561.58 |
What You Will Receive
- Customizable Excel Template: A fully adaptable Excel-based DCF Calculator featuring pre-filled financial data for Glencore plc (GLENL).
- Accurate Data: Historical figures and projected estimates (highlighted in the yellow cells).
- Adjustable Forecasting: Modify key assumptions such as revenue growth, EBITDA %, and WACC.
- Instant Calculations: Quickly observe how your inputs influence Glencore's valuation.
- Professional Resource: Designed for investors, CFOs, consultants, and financial analysts.
- Intuitive Layout: Organized for simplicity and user-friendliness, complete with step-by-step guidance.
Key Features
- Comprehensive GLEN Data: Pre-loaded with Glencore’s historical financials and projections for future performance.
- Fully Customizable Parameters: Tailor revenue growth, profit margins, WACC, tax rates, and capital expenditures to your needs.
- Dynamic Valuation Framework: Automatic recalculations of Net Present Value (NPV) and intrinsic value based on your adjustments.
- Scenario Analysis: Develop various forecasting scenarios to examine different valuation possibilities.
- User-Friendly Interface: Intuitive and organized design suitable for both experienced professionals and newcomers.
How It Functions
- Step 1: Download the Excel file.
- Step 2: Examine the pre-filled Glencore data (historical and projected).
- Step 3: Modify key assumptions (yellow cells) in accordance with your analysis.
- Step 4: Observe automatic recalculations for Glencore’s intrinsic value.
- Step 5: Utilize the outputs for investment strategies or reporting.
Why Opt for This Calculator?
- Precision: Real Glencore financials guarantee accurate data.
- Versatility: Built for users to effortlessly test and adjust variables.
- Efficiency: Eliminate the need to create a DCF model from the ground up.
- Expert-Level: Crafted with CFO-level accuracy and usability as a priority.
- Intuitive: Simple to navigate, even for individuals without extensive financial modeling knowledge.
Who Should Utilize This Service?
- Individual Investors: Gain the knowledge needed to make strategic decisions regarding Glencore plc (GLENL) shares.
- Financial Analysts: Enhance valuation methodologies with comprehensive financial models tailored for Glencore plc (GLENL).
- Consultants: Provide clients with precise and timely valuation insights on Glencore plc (GLENL).
- Business Owners: Learn about the valuation processes of major companies like Glencore plc (GLENL) to inform your business strategy.
- Finance Students: Explore valuation principles using real-time data and practical examples related to Glencore plc (GLENL).
Overview of the Template Components
- Comprehensive DCF Model: An editable template featuring detailed valuation calculations tailored for Glencore plc (GLENL).
- Real-World Data: Historical and projected financials for Glencore preloaded for thorough analysis.
- Customizable Parameters: Modify WACC, growth rates, and tax assumptions to explore various scenarios.
- Financial Statements: Complete annual and quarterly financial breakdowns for enhanced insights.
- Key Ratios: Integrated analysis for profit margins, operational efficiency, and capital structure.
- Dashboard with Visual Outputs: Charts and tables provide clear, actionable insights into performance.
Disclaimer
All information, articles, and product details provided on this website are for general informational and educational purposes only. We do not claim any ownership over, nor do we intend to infringe upon, any trademarks, copyrights, logos, brand names, or other intellectual property mentioned or depicted on this site. Such intellectual property remains the property of its respective owners, and any references here are made solely for identification or informational purposes, without implying any affiliation, endorsement, or partnership.
We make no representations or warranties, express or implied, regarding the accuracy, completeness, or suitability of any content or products presented. Nothing on this website should be construed as legal, tax, investment, financial, medical, or other professional advice. In addition, no part of this site—including articles or product references—constitutes a solicitation, recommendation, endorsement, advertisement, or offer to buy or sell any securities, franchises, or other financial instruments, particularly in jurisdictions where such activity would be unlawful.
All content is of a general nature and may not address the specific circumstances of any individual or entity. It is not a substitute for professional advice or services. Any actions you take based on the information provided here are strictly at your own risk. You accept full responsibility for any decisions or outcomes arising from your use of this website and agree to release us from any liability in connection with your use of, or reliance upon, the content or products found herein.