
|
Glenmark Pharmaceuticals Limited (Glenmark.NS) Valoración de DCF |
Completamente Editable: Adáptelo A Sus Necesidades En Excel O Sheets
Diseño Profesional: Plantillas Confiables Y Estándares De La Industria
Predeterminadas Para Un Uso Rápido Y Eficiente
Compatible con MAC / PC, completamente desbloqueado
No Se Necesita Experiencia; Fáciles De Seguir
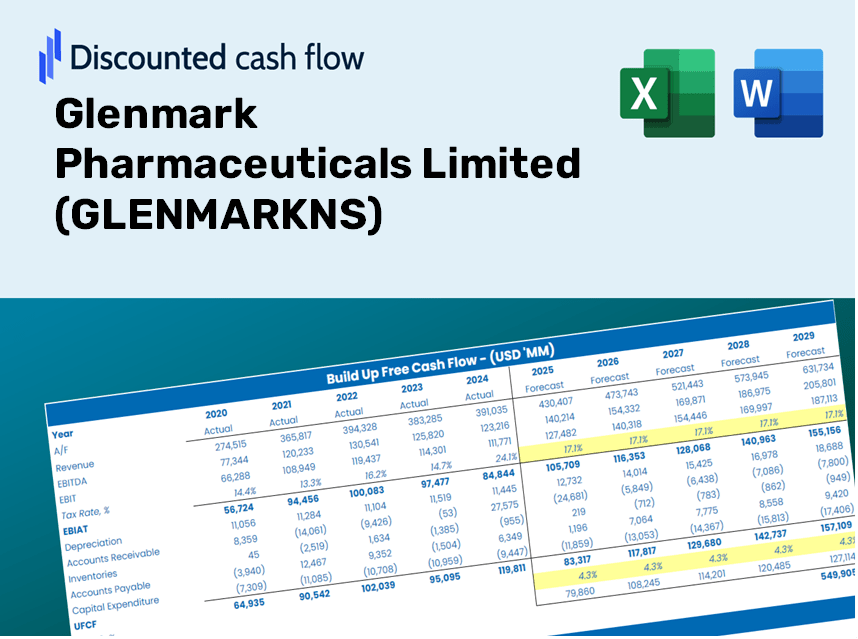
Glenmark Pharmaceuticals Limited (GLENMARK.NS) Bundle
¡Agilice su análisis y mejore la precisión con nuestra calculadora DCF (GlenMarkns)! Utilizando datos reales de supuestos limitados y personalizables de Glenmark Pharmaceuticals, esta herramienta le permite pronosticar, analizar y valorar Glenmark como un inversor experto.
Discounted Cash Flow (DCF) - (USD MM)
| Year | AY1 2021 |
AY2 2022 |
AY3 2023 |
AY4 2024 |
AY5 2025 |
FY1 2026 |
FY2 2027 |
FY3 2028 |
FY4 2029 |
FY5 2030 |
|---|---|---|---|---|---|---|---|---|---|---|
| Revenue | 109,439.3 | 123,049.0 | 116,555.6 | 126,453.8 | 133,632.9 | 140,758.4 | 148,263.7 | 156,169.2 | 164,496.3 | 173,267.4 |
| Revenue Growth, % | 0 | 12.44 | -5.28 | 8.49 | 5.68 | 5.33 | 5.33 | 5.33 | 5.33 | 5.33 |
| EBITDA | 19,447.7 | 19,124.4 | 14,288.8 | 18,296.7 | 21,675.8 | 21,468.8 | 22,613.5 | 23,819.3 | 25,089.3 | 26,427.1 |
| EBITDA, % | 17.77 | 15.54 | 12.26 | 14.47 | 16.22 | 15.25 | 15.25 | 15.25 | 15.25 | 15.25 |
| Depreciation | 2,287.3 | 723.9 | 2,907.2 | 3,839.6 | 2,606.5 | 2,860.1 | 3,012.6 | 3,173.2 | 3,342.4 | 3,520.6 |
| Depreciation, % | 2.09 | 0.58833 | 2.49 | 3.04 | 1.95 | 2.03 | 2.03 | 2.03 | 2.03 | 2.03 |
| EBIT | 17,160.4 | 18,400.5 | 11,381.6 | 14,457.1 | 19,069.3 | 18,608.7 | 19,600.9 | 20,646.1 | 21,746.9 | 22,906.5 |
| EBIT, % | 15.68 | 14.95 | 9.76 | 11.43 | 14.27 | 13.22 | 13.22 | 13.22 | 13.22 | 13.22 |
| Total Cash | 11,474.4 | 14,434.0 | 11,732.9 | 16,640.5 | 17,676.7 | 16,516.2 | 17,396.8 | 18,324.4 | 19,301.5 | 20,330.7 |
| Total Cash, percent | .0 | .0 | .0 | .0 | .0 | .0 | .0 | .0 | .0 | .0 |
| Account Receivables | 25,720.6 | 31,011.4 | 32,464.2 | 18,584.1 | 33,419.5 | 32,729.8 | 34,475.0 | 36,313.2 | 38,249.4 | 40,288.9 |
| Account Receivables, % | 23.5 | 25.2 | 27.85 | 14.7 | 25.01 | 23.25 | 23.25 | 23.25 | 23.25 | 23.25 |
| Inventories | 22,768.3 | 24,998.3 | 23,736.2 | 25,130.5 | 30,285.3 | 29,283.7 | 30,845.2 | 32,489.8 | 34,222.2 | 36,047.0 |
| Inventories, % | 20.8 | 20.32 | 20.36 | 19.87 | 22.66 | 20.8 | 20.8 | 20.8 | 20.8 | 20.8 |
| Accounts Payable | 22,377.7 | 22,886.6 | 20,004.3 | 25,359.3 | 25,795.3 | 26,903.8 | 28,338.3 | 29,849.3 | 31,440.9 | 33,117.4 |
| Accounts Payable, % | 20.45 | 18.6 | 17.16 | 20.05 | 19.3 | 19.11 | 19.11 | 19.11 | 19.11 | 19.11 |
| Capital Expenditure | -7,747.6 | -7,901.2 | -6,077.6 | -8,983.8 | -7,495.7 | -8,847.6 | -9,319.4 | -9,816.3 | -10,339.7 | -10,891.0 |
| Capital Expenditure, % | -7.08 | -6.42 | -5.21 | -7.1 | -5.61 | -6.29 | -6.29 | -6.29 | -6.29 | -6.29 |
| Tax Rate, % | 25.17 | 25.17 | 25.17 | 25.17 | 25.17 | 25.17 | 25.17 | 25.17 | 25.17 | 25.17 |
| EBITAT | 12,040.9 | 12,022.9 | 14,105.6 | -594,870.0 | 14,270.5 | 11,550.1 | 12,166.0 | 12,814.7 | 13,498.0 | 14,217.7 |
| Depreciation | ||||||||||
| Changes in Account Receivables | ||||||||||
| Changes in Inventories | ||||||||||
| Changes in Accounts Payable | ||||||||||
| Capital Expenditure | ||||||||||
| UFCF | -19,530.6 | -2,166.2 | 7,862.1 | -582,173.4 | -10,172.8 | 8,362.3 | 3,987.1 | 4,199.7 | 4,423.6 | 4,659.5 |
| WACC, % | 5.26 | 5.24 | 5.37 | 5 | 5.28 | 5.23 | 5.23 | 5.23 | 5.23 | 5.23 |
| PV UFCF | ||||||||||
| SUM PV UFCF | 22,370.1 | |||||||||
| Long Term Growth Rate, % | 4.00 | |||||||||
| Free cash flow (T + 1) | 4,846 | |||||||||
| Terminal Value | 393,970 | |||||||||
| Present Terminal Value | 305,327 | |||||||||
| Enterprise Value | 327,697 | |||||||||
| Net Debt | 7,970 | |||||||||
| Equity Value | 319,727 | |||||||||
| Diluted Shares Outstanding, MM | 282 | |||||||||
| Equity Value Per Share | 1,132.94 |
What You Will Receive
- Comprehensive Financial Model: Utilize Glenmark Pharmaceuticals Limited's actual data for accurate DCF analysis.
- Complete Forecasting Control: Modify revenue growth rates, profit margins, WACC, and other essential factors.
- Real-Time Calculations: Automatic updates provide immediate insights as you adjust inputs.
- Professional-Grade Template: A polished Excel file crafted for high-quality financial valuation.
- Flexible and Reusable: Designed with adaptability in mind for ongoing, detailed forecast needs.
Key Features
- Comprehensive DCF Calculator: Features detailed unlevered and levered DCF valuation models tailored for Glenmark Pharmaceuticals Limited (GLENMARKNS).
- WACC Calculator: Comes with a pre-configured Weighted Average Cost of Capital sheet that allows for customizable inputs.
- Customizable Forecast Assumptions: Easily adjust growth rates, capital expenditures, and discount rates as per your analysis needs.
- Integrated Financial Ratios: Evaluate profitability, leverage, and efficiency ratios specifically for Glenmark Pharmaceuticals Limited (GLENMARKNS).
- Interactive Dashboard and Charts: Visual representations of key valuation metrics simplify the analysis process.
How It Operates
- Step 1: Download the prebuilt Excel template featuring Glenmark Pharmaceuticals Limited (GLENMARKNS) data.
- Step 2: Navigate through the pre-filled sheets to familiarize yourself with the essential metrics.
- Step 3: Modify forecasts and assumptions in the editable yellow cells (WACC, growth, margins).
- Step 4: Instantly view updated results, including the intrinsic value of Glenmark Pharmaceuticals Limited (GLENMARKNS).
- Step 5: Make well-informed investment choices or create reports based on the generated outputs.
Why Opt for Glenmark Pharmaceuticals Limited (GLENMARKNS)?
- Time Efficient: No need to build a financial model from the ground up – our resources are readily available.
- Enhanced Accuracy: Dependable financial data and established formulas minimize valuation errors.
- Fully Adjustable: Customize the model to align with your specific assumptions and forecasts.
- Simple to Analyze: Intuitive charts and outputs facilitate straightforward interpretation of results.
- Endorsed by Professionals: Crafted for experts who prioritize precision and usability.
Who Can Benefit from This Product?
- Investors: Make informed choices with a top-tier valuation tool designed for precision.
- Financial Analysts: Streamline your workflow with a ready-to-use DCF model that allows for easy customization.
- Consultants: Quickly modify the template to suit client presentations or reports with ease.
- Finance Enthusiasts: Enhance your knowledge of valuation methods through practical, real-world examples.
- Educators and Students: Utilize this resource as a hands-on learning tool in finance-focused courses.
Contents of the Template
- Pre-Filled Data: Contains Glenmark Pharmaceuticals Limited's historical financials and projections.
- Discounted Cash Flow Model: An editable DCF valuation model with automatic calculations.
- Weighted Average Cost of Capital (WACC): A dedicated sheet for WACC calculation based on your custom inputs.
- Key Financial Ratios: Evaluate Glenmark's profitability, efficiency, and leverage metrics.
- Customizable Inputs: Easily modify revenue growth, margins, and tax rates.
- User-Friendly Dashboard: Visuals and tables that summarize essential valuation findings.
Disclaimer
All information, articles, and product details provided on this website are for general informational and educational purposes only. We do not claim any ownership over, nor do we intend to infringe upon, any trademarks, copyrights, logos, brand names, or other intellectual property mentioned or depicted on this site. Such intellectual property remains the property of its respective owners, and any references here are made solely for identification or informational purposes, without implying any affiliation, endorsement, or partnership.
We make no representations or warranties, express or implied, regarding the accuracy, completeness, or suitability of any content or products presented. Nothing on this website should be construed as legal, tax, investment, financial, medical, or other professional advice. In addition, no part of this site—including articles or product references—constitutes a solicitation, recommendation, endorsement, advertisement, or offer to buy or sell any securities, franchises, or other financial instruments, particularly in jurisdictions where such activity would be unlawful.
All content is of a general nature and may not address the specific circumstances of any individual or entity. It is not a substitute for professional advice or services. Any actions you take based on the information provided here are strictly at your own risk. You accept full responsibility for any decisions or outcomes arising from your use of this website and agree to release us from any liability in connection with your use of, or reliance upon, the content or products found herein.