
|
Société Générale Société Anonymeo (Gle.PA) DCF Valoración |
Completamente Editable: Adáptelo A Sus Necesidades En Excel O Sheets
Diseño Profesional: Plantillas Confiables Y Estándares De La Industria
Predeterminadas Para Un Uso Rápido Y Eficiente
Compatible con MAC / PC, completamente desbloqueado
No Se Necesita Experiencia; Fáciles De Seguir
Société Générale SA (GLE.PA) Bundle
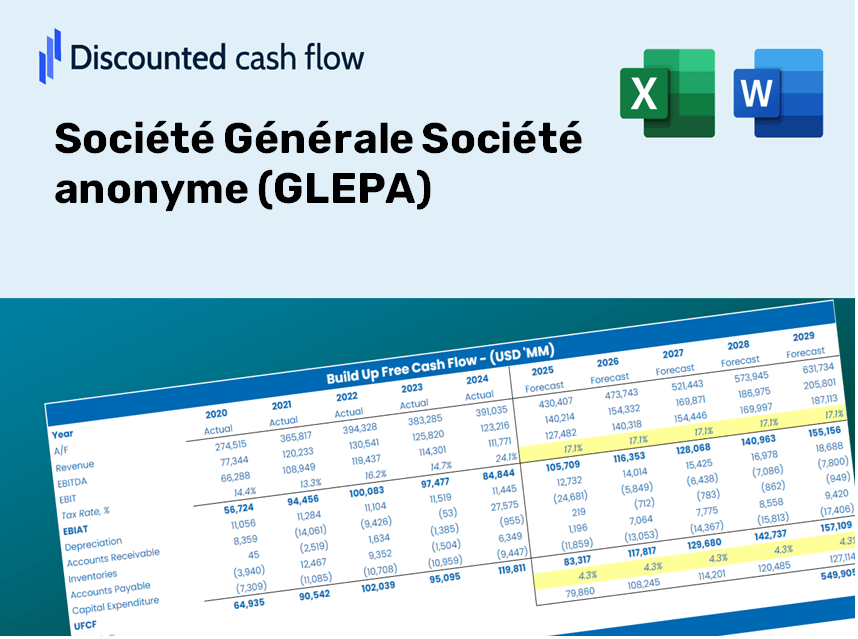
¡Evalúe la perspectiva financiera de Société Générale Société Anonymeo (GLEPA) como un experto! Esta calculadora DCF (GLEPA) proporciona datos financieros previamente rellenos y ofrece una flexibilidad total para modificar el crecimiento de los ingresos, WACC, los márgenes y otros supuestos esenciales para alinearse con sus proyecciones.
Discounted Cash Flow (DCF) - (USD MM)
| Year | AY1 2020 |
AY2 2021 |
AY3 2022 |
AY4 2023 |
AY5 2024 |
FY1 2025 |
FY2 2026 |
FY3 2027 |
FY4 2028 |
FY5 2029 |
|---|---|---|---|---|---|---|---|---|---|---|
| Revenue | 42,269.0 | 46,120.0 | 53,993.0 | 87,136.0 | 97,636.0 | 121,951.1 | 152,321.6 | 190,255.6 | 237,636.6 | 296,817.2 |
| Revenue Growth, % | 0 | 9.11 | 17.07 | 61.38 | 12.05 | 24.9 | 24.9 | 24.9 | 24.9 | 24.9 |
| EBITDA | 6,663.0 | 13,479.0 | 9,581.0 | 12,838.0 | 16,816.0 | 23,095.2 | 28,846.9 | 36,030.8 | 45,003.9 | 56,211.6 |
| EBITDA, % | 15.76 | 29.23 | 17.74 | 14.73 | 17.22 | 18.94 | 18.94 | 18.94 | 18.94 | 18.94 |
| Depreciation | 5,263.0 | 5,444.0 | 5,342.0 | 7,710.0 | 10,086.0 | 13,006.7 | 16,245.9 | 20,291.7 | 25,345.1 | 31,657.0 |
| Depreciation, % | 12.45 | 11.8 | 9.89 | 8.85 | 10.33 | 10.67 | 10.67 | 10.67 | 10.67 | 10.67 |
| EBIT | 1,400.0 | 8,035.0 | 4,239.0 | 5,128.0 | 6,730.0 | 10,088.5 | 12,601.0 | 15,739.1 | 19,658.8 | 24,554.5 |
| EBIT, % | 3.31 | 17.42 | 7.85 | 5.89 | 6.89 | 8.27 | 8.27 | 8.27 | 8.27 | 8.27 |
| Total Cash | 498,124.0 | 411,604.0 | 540,840.0 | 591,827.0 | 589,612.0 | 121,951.1 | 152,321.6 | 190,255.6 | 237,636.6 | 296,817.2 |
| Total Cash, percent | .0 | .0 | .0 | .0 | .0 | .0 | .0 | .0 | .0 | .0 |
| Account Receivables | 8,899.0 | 8,215.0 | 9,507.0 | 13,895.0 | 13,890.0 | 21,133.1 | 26,396.1 | 32,969.8 | 41,180.5 | 51,436.0 |
| Account Receivables, % | 21.05 | 17.81 | 17.61 | 15.95 | 14.23 | 17.33 | 17.33 | 17.33 | 17.33 | 17.33 |
| Inventories | .0 | .0 | .0 | .0 | .0 | .0 | .0 | .0 | .0 | .0 |
| Inventories, % | 0 | 0 | 0 | 0 | 0 | 0 | 0 | 0 | 0 | 0 |
| Accounts Payable | 299.0 | 261.0 | .0 | .0 | .0 | 310.6 | 387.9 | 484.5 | 605.2 | 755.9 |
| Accounts Payable, % | 0.70737 | 0.56592 | 0 | 0 | 0 | 0.25466 | 0.25466 | 0.25466 | 0.25466 | 0.25466 |
| Capital Expenditure | -5,588.0 | -6,466.0 | -9,594.0 | -11,867.0 | -11,433.0 | -17,155.5 | -21,427.9 | -26,764.3 | -33,429.7 | -41,754.9 |
| Capital Expenditure, % | -13.22 | -14.02 | -17.77 | -13.62 | -11.71 | -14.07 | -14.07 | -14.07 | -14.07 | -14.07 |
| Tax Rate, % | 37.59 | 37.59 | 37.59 | 37.59 | 37.59 | 37.59 | 37.59 | 37.59 | 37.59 | 37.59 |
| EBITAT | -258.0 | 5,641.0 | 1,825.0 | 2,493.0 | 4,200.0 | 4,525.3 | 5,652.3 | 7,060.0 | 8,818.2 | 11,014.2 |
| Depreciation | ||||||||||
| Changes in Account Receivables | ||||||||||
| Changes in Inventories | ||||||||||
| Changes in Accounts Payable | ||||||||||
| Capital Expenditure | ||||||||||
| UFCF | -9,183.0 | 5,265.0 | -3,980.0 | -6,052.0 | 2,858.0 | -6,556.1 | -4,715.4 | -5,889.7 | -7,356.4 | -9,188.5 |
| WACC, % | 1.67 | 15.61 | 10.22 | 11.32 | 14.06 | 10.57 | 10.57 | 10.57 | 10.57 | 10.57 |
| PV UFCF | ||||||||||
| SUM PV UFCF | -24,621.8 | |||||||||
| Long Term Growth Rate, % | 2.00 | |||||||||
| Free cash flow (T + 1) | -9,372 | |||||||||
| Terminal Value | -109,306 | |||||||||
| Present Terminal Value | -66,126 | |||||||||
| Enterprise Value | -90,748 | |||||||||
| Net Debt | -91,635 | |||||||||
| Equity Value | 887 | |||||||||
| Diluted Shares Outstanding, MM | 795 | |||||||||
| Equity Value Per Share | 1.12 |
What You Will Receive
- Authentic Société Générale Data: Pre-loaded financial metrics – covering everything from revenue to EBIT – based on both actual and projected numbers.
- Total Customization: Modify all essential parameters (yellow cells) such as WACC, growth %, and tax rates.
- Immediate Valuation Adjustments: Automatic recalculations to assess how changes affect the fair value of Société Générale (GLEPA).
- Flexible Excel Template: Designed for easy modifications, scenario analysis, and comprehensive projections.
- Efficient and Precise: Avoid the hassle of building models from the ground up while ensuring accuracy and adaptability.
Key Features
- Real-Life GLEPA Data: Pre-filled with Société Générale's historical financials and future projections.
- Fully Customizable Inputs: Modify revenue growth, profit margins, WACC, tax rates, and capital expenditures to fit your analysis.
- Dynamic Valuation Model: Automatically recalculates Net Present Value (NPV) and intrinsic value based on your custom inputs.
- Scenario Testing: Develop various forecast scenarios to evaluate different potential valuation outcomes.
- User-Friendly Design: Intuitive structure that caters to both professionals and beginners.
How It Functions
- Download: Obtain the ready-to-use Excel file containing Société Générale’s financial data (GLEPA).
- Customize: Modify forecasts, including revenue growth, EBITDA %, and WACC.
- Update Automatically: The intrinsic value and NPV calculations refresh in real-time.
- Test Scenarios: Generate multiple projections and quickly compare the results.
- Make Decisions: Utilize the valuation outcomes to inform your investment strategy.
Why Opt for This Calculator?
- Reliable Data: Authentic financial information from Société Générale (GLEPA) guarantees trustworthy valuation outcomes.
- Fully Customizable: Tailor essential factors such as growth rates, WACC, and tax rates to align with your financial forecasts.
- Efficiency Boost: Built-in calculations save you time by eliminating the need to create formulas from the ground up.
- Professional Quality: Crafted specifically for use by investors, analysts, and financial consultants.
- Easy to Use: User-friendly interface and guided instructions ensure accessibility for all levels of expertise.
Who Can Benefit from This Product?
- Professional Investors: Develop intricate and dependable valuation models for portfolio assessments related to Société Générale (GLEPA).
- Corporate Finance Teams: Evaluate valuation scenarios to inform strategic decisions within the organization.
- Consultants and Advisors: Deliver precise valuation insights for clients interested in Société Générale (GLEPA).
- Students and Educators: Utilize real-world data to enhance financial modeling skills and education.
- Finance Enthusiasts: Gain insight into how financial institutions like Société Générale (GLEPA) are assessed in the market.
Contents of the Template
- Pre-Filled DCF Model: Financial data for Société Générale (GLEPA) preloaded for immediate analysis.
- WACC Calculator: Comprehensive calculations for the Weighted Average Cost of Capital.
- Financial Ratios: Assess Société Générale's (GLEPA) profitability, leverage, and operational efficiency.
- Editable Inputs: Customize assumptions such as growth rates, profit margins, and capital expenditures to match your scenarios.
- Financial Statements: Access annual and quarterly reports for in-depth analysis.
- Interactive Dashboard: Easily visualize essential valuation metrics and outcomes.
Disclaimer
All information, articles, and product details provided on this website are for general informational and educational purposes only. We do not claim any ownership over, nor do we intend to infringe upon, any trademarks, copyrights, logos, brand names, or other intellectual property mentioned or depicted on this site. Such intellectual property remains the property of its respective owners, and any references here are made solely for identification or informational purposes, without implying any affiliation, endorsement, or partnership.
We make no representations or warranties, express or implied, regarding the accuracy, completeness, or suitability of any content or products presented. Nothing on this website should be construed as legal, tax, investment, financial, medical, or other professional advice. In addition, no part of this site—including articles or product references—constitutes a solicitation, recommendation, endorsement, advertisement, or offer to buy or sell any securities, franchises, or other financial instruments, particularly in jurisdictions where such activity would be unlawful.
All content is of a general nature and may not address the specific circumstances of any individual or entity. It is not a substitute for professional advice or services. Any actions you take based on the information provided here are strictly at your own risk. You accept full responsibility for any decisions or outcomes arising from your use of this website and agree to release us from any liability in connection with your use of, or reliance upon, the content or products found herein.