
|
Gujarat Mineral Development Corporation Limited (GMDCLTD.NS) Valoración de DCF |
Completamente Editable: Adáptelo A Sus Necesidades En Excel O Sheets
Diseño Profesional: Plantillas Confiables Y Estándares De La Industria
Predeterminadas Para Un Uso Rápido Y Eficiente
Compatible con MAC / PC, completamente desbloqueado
No Se Necesita Experiencia; Fáciles De Seguir
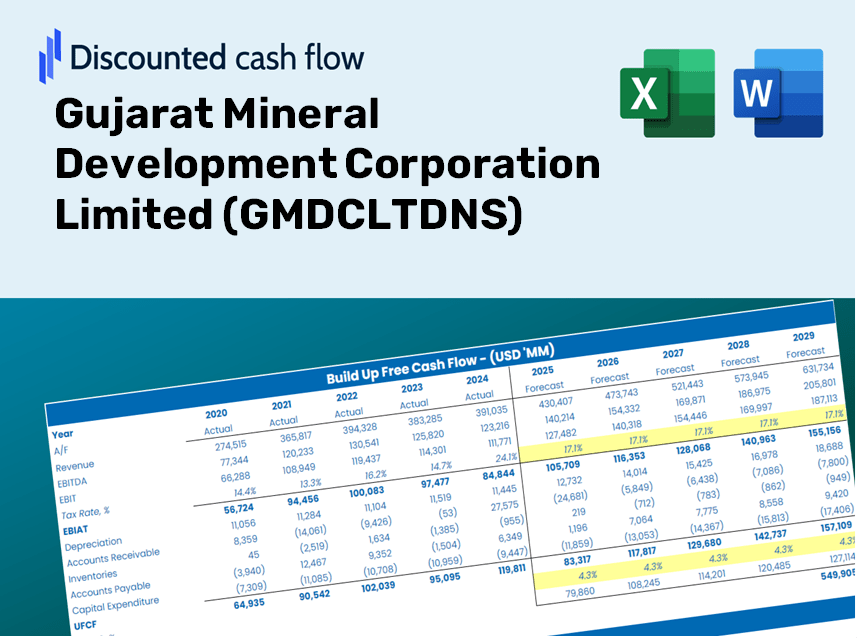
Gujarat Mineral Development Corporation Limited (GMDCLTD.NS) Bundle
¿Busca evaluar el valor intrínseco de Gujarat Mineral Development Corporation Limited? Nuestra calculadora GMDCLTDNS DCF integra datos del mundo real con opciones de personalización integrales, lo que le permite refinar sus pronósticos y mejorar sus decisiones de inversión.
Discounted Cash Flow (DCF) - (USD MM)
| Year | AY1 2021 |
AY2 2022 |
AY3 2023 |
AY4 2024 |
AY5 2025 |
FY1 2026 |
FY2 2027 |
FY3 2028 |
FY4 2029 |
FY5 2030 |
|---|---|---|---|---|---|---|---|---|---|---|
| Revenue | 13,426.3 | 27,320.8 | 34,978.8 | 25,145.4 | 29,615.7 | 38,329.8 | 49,607.9 | 64,204.4 | 83,095.8 | 107,545.7 |
| Revenue Growth, % | 0 | 103.49 | 28.03 | -28.11 | 17.78 | 29.42 | 29.42 | 29.42 | 29.42 | 29.42 |
| EBITDA | -51.1 | 7,218.7 | 13,384.7 | 6,630.8 | 7,697.8 | 8,943.8 | 11,575.4 | 14,981.3 | 19,389.3 | 25,094.4 |
| EBITDA, % | -0.38037 | 26.42 | 38.27 | 26.37 | 25.99 | 23.33 | 23.33 | 23.33 | 23.33 | 23.33 |
| Depreciation | 948.4 | 964.9 | 800.0 | 772.7 | 953.7 | 1,470.0 | 1,902.6 | 2,462.4 | 3,186.9 | 4,124.6 |
| Depreciation, % | 7.06 | 3.53 | 2.29 | 3.07 | 3.22 | 3.84 | 3.84 | 3.84 | 3.84 | 3.84 |
| EBIT | -999.5 | 6,253.7 | 12,584.7 | 5,858.1 | 6,744.1 | 7,473.7 | 9,672.8 | 12,518.9 | 16,202.5 | 20,969.8 |
| EBIT, % | -7.44 | 22.89 | 35.98 | 23.3 | 22.77 | 19.5 | 19.5 | 19.5 | 19.5 | 19.5 |
| Total Cash | 2,722.6 | 734.9 | 15,141.9 | 551.6 | 1,373.4 | 5,602.9 | 7,251.5 | 9,385.1 | 12,146.6 | 15,720.6 |
| Total Cash, percent | .0 | .0 | .0 | .0 | .0 | .0 | .0 | .0 | .0 | .0 |
| Account Receivables | 1,452.5 | 2,177.9 | 1,913.7 | 1,062.9 | 899.1 | 2,416.6 | 3,127.7 | 4,047.9 | 5,239.0 | 6,780.5 |
| Account Receivables, % | 10.82 | 7.97 | 5.47 | 4.23 | 3.04 | 6.3 | 6.3 | 6.3 | 6.3 | 6.3 |
| Inventories | 985.0 | 898.1 | 1,069.8 | 1,064.8 | 913.3 | 1,609.8 | 2,083.5 | 2,696.6 | 3,490.0 | 4,516.9 |
| Inventories, % | 7.34 | 3.29 | 3.06 | 4.23 | 3.08 | 4.2 | 4.2 | 4.2 | 4.2 | 4.2 |
| Accounts Payable | 1,759.7 | 2,004.1 | 2,059.3 | 2,718.2 | 2,356.6 | 3,457.1 | 4,474.2 | 5,790.7 | 7,494.6 | 9,699.8 |
| Accounts Payable, % | 13.11 | 7.34 | 5.89 | 10.81 | 7.96 | 9.02 | 9.02 | 9.02 | 9.02 | 9.02 |
| Capital Expenditure | -121.8 | -408.5 | -238.8 | -4,768.9 | -6,440.2 | -3,357.4 | -4,345.3 | -5,623.8 | -7,278.5 | -9,420.2 |
| Capital Expenditure, % | -0.90747 | -1.5 | -0.68256 | -18.97 | -21.75 | -8.76 | -8.76 | -8.76 | -8.76 | -8.76 |
| Tax Rate, % | 23.35 | 23.35 | 23.35 | 23.35 | 23.35 | 23.35 | 23.35 | 23.35 | 23.35 | 23.35 |
| EBITAT | -104.1 | 3,585.9 | 9,191.2 | 4,384.5 | 5,169.7 | 4,369.0 | 5,654.6 | 7,318.4 | 9,471.7 | 12,258.7 |
| Depreciation | ||||||||||
| Changes in Account Receivables | ||||||||||
| Changes in Inventories | ||||||||||
| Changes in Accounts Payable | ||||||||||
| Capital Expenditure | ||||||||||
| UFCF | 44.7 | 3,748.2 | 9,900.2 | 1,903.1 | -363.2 | 1,368.1 | 3,044.3 | 3,940.1 | 5,099.4 | 6,599.9 |
| WACC, % | 5.24 | 5.25 | 5.26 | 5.26 | 5.26 | 5.25 | 5.25 | 5.25 | 5.25 | 5.25 |
| PV UFCF | ||||||||||
| SUM PV UFCF | 16,691.5 | |||||||||
| Long Term Growth Rate, % | 3.00 | |||||||||
| Free cash flow (T + 1) | 6,798 | |||||||||
| Terminal Value | 301,736 | |||||||||
| Present Terminal Value | 233,591 | |||||||||
| Enterprise Value | 250,283 | |||||||||
| Net Debt | -4,563 | |||||||||
| Equity Value | 254,845 | |||||||||
| Diluted Shares Outstanding, MM | 318 | |||||||||
| Equity Value Per Share | 801.40 |
Benefits You Will Receive
- Dynamic Forecast Inputs: Effortlessly adjust key parameters (growth %, margins, WACC) to explore various scenarios.
- Actual Financial Data: GMDCLTDNS’s financial information pre-loaded to enhance your analysis from the start.
- Automated DCF Calculations: The model computes Net Present Value (NPV) and intrinsic value automatically for you.
- Customizable and Professional Design: A refined Excel template that caters to your valuation requirements.
- Designed for Analysts and Investors: Perfect for evaluating projections, confirming strategies, and optimizing efficiency.
Key Features
- Comprehensive GMDCLTDNS Data: Comes equipped with Gujarat Mineral Development Corporation Limited’s historical financial data and future projections.
- Fully Customizable Variables: Modify parameters such as revenue growth, profit margins, discount rates, tax percentages, and capital investments.
- Dynamic Valuation Framework: Instant recalculations of Net Present Value (NPV) and intrinsic value based on your customized inputs.
- Scenario Analysis: Develop various forecasting scenarios to investigate different valuation possibilities.
- User-Centric Interface: Intuitive, organized, and tailored for both industry professionals and newcomers.
How It Operates
- Download the Template: Gain immediate access to the Excel-based GMDCLTDNS DCF Calculator.
- Input Your Assumptions: Modify the yellow-highlighted cells for growth rates, WACC, margins, and more.
- Instant Calculations: The model automatically adjusts GMDCLTDNS’s intrinsic value.
- Test Scenarios: Experiment with various assumptions to assess potential valuation changes.
- Analyze and Decide: Utilize the results to inform your investment or financial analysis.
Why Opt for This Calculator?
- Precise Data: Utilize authentic financials from Gujarat Mineral Development Corporation Limited (GMDCLTDNS) for trustworthy valuation outcomes.
- Personalizable: Modify essential metrics such as growth rates, WACC, and tax rates to align with your forecasts.
- Efficient: Pre-configured calculations remove the hassle of starting from scratch.
- Professional-Grade Resource: Tailored for investors, analysts, and consultants in the field.
- Easy to Use: Simple interface and guided instructions ensure accessibility for all users.
Who Can Benefit from This Product?
- Investors: Assess the valuation of Gujarat Mineral Development Corporation Limited (GMDCLTDNS) before making stock transactions.
- CFOs and Financial Analysts: Optimize valuation methods and evaluate projections for better decision-making.
- Startup Founders: Understand the valuation techniques used for significant public entities like GMDCLTDNS.
- Consultants: Provide detailed valuation analysis and reports for your clientele.
- Students and Educators: Utilize actual data for practicing and teaching valuation strategies.
Contents of the Template
- Operating and Balance Sheet Data: Pre-filled historical data and forecasts for Gujarat Mineral Development Corporation Limited (GMDCLTDNS), including revenue, EBITDA, EBIT, and capital expenditures.
- WACC Calculation: A dedicated sheet for Weighted Average Cost of Capital (WACC), featuring key parameters such as Beta, risk-free rate, and share price.
- DCF Valuation (Unlevered and Levered): Customizable Discounted Cash Flow models that display intrinsic value along with detailed calculations.
- Financial Statements: Pre-loaded financial statements (annual and quarterly) to facilitate thorough analysis.
- Key Ratios: Includes profitability, leverage, and efficiency ratios for Gujarat Mineral Development Corporation Limited (GMDCLTDNS).
- Dashboard and Charts: Visual representations of valuation outputs and assumptions, making it easy to analyze results.
Disclaimer
All information, articles, and product details provided on this website are for general informational and educational purposes only. We do not claim any ownership over, nor do we intend to infringe upon, any trademarks, copyrights, logos, brand names, or other intellectual property mentioned or depicted on this site. Such intellectual property remains the property of its respective owners, and any references here are made solely for identification or informational purposes, without implying any affiliation, endorsement, or partnership.
We make no representations or warranties, express or implied, regarding the accuracy, completeness, or suitability of any content or products presented. Nothing on this website should be construed as legal, tax, investment, financial, medical, or other professional advice. In addition, no part of this site—including articles or product references—constitutes a solicitation, recommendation, endorsement, advertisement, or offer to buy or sell any securities, franchises, or other financial instruments, particularly in jurisdictions where such activity would be unlawful.
All content is of a general nature and may not address the specific circumstances of any individual or entity. It is not a substitute for professional advice or services. Any actions you take based on the information provided here are strictly at your own risk. You accept full responsibility for any decisions or outcomes arising from your use of this website and agree to release us from any liability in connection with your use of, or reliance upon, the content or products found herein.