
|
Valoración DCF de Ferroglobe PLC (GSM) |
Completamente Editable: Adáptelo A Sus Necesidades En Excel O Sheets
Diseño Profesional: Plantillas Confiables Y Estándares De La Industria
Predeterminadas Para Un Uso Rápido Y Eficiente
Compatible con MAC / PC, completamente desbloqueado
No Se Necesita Experiencia; Fáciles De Seguir
Ferroglobe PLC (GSM) Bundle
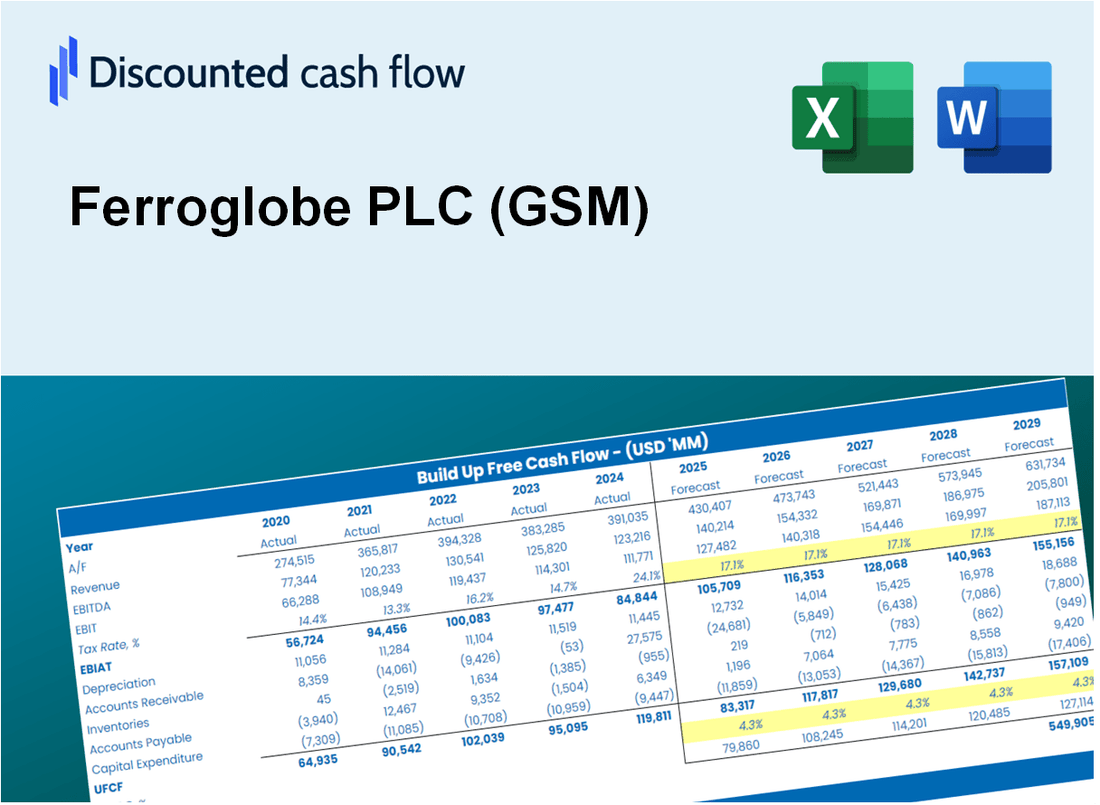
¡Valoración de strewline FerrogLobe PLC (GSM) con esta calculadora DCF fácil de usar! Equipado con datos financieros reales de Ferroglobe PLC (GSM) y entradas de pronóstico flexibles, puede explorar diferentes escenarios y determinar el valor razonable de FerrogLobe PLC (GSM) en solo minutos.
Discounted Cash Flow (DCF) - (USD MM)
| Year | AY1 2020 |
AY2 2021 |
AY3 2022 |
AY4 2023 |
AY5 2024 |
FY1 2025 |
FY2 2026 |
FY3 2027 |
FY4 2028 |
FY5 2029 |
|---|---|---|---|---|---|---|---|---|---|---|
| Revenue | 1,144.4 | 1,778.9 | 2,597.9 | 1,650.0 | 1,643.9 | 1,909.5 | 2,218.0 | 2,576.4 | 2,992.6 | 3,476.1 |
| Revenue Growth, % | 0 | 55.44 | 46.04 | -36.49 | -0.36939 | 16.16 | 16.16 | 16.16 | 16.16 | 16.16 |
| EBITDA | -69.1 | 33.7 | 725.5 | 263.1 | 128.0 | 181.5 | 210.8 | 244.8 | 284.4 | 330.3 |
| EBITDA, % | -6.04 | 1.9 | 27.93 | 15.94 | 7.79 | 9.5 | 9.5 | 9.5 | 9.5 | 9.5 |
| Depreciation | 108.2 | 97.3 | 81.6 | 73.5 | 75.5 | 103.5 | 120.3 | 139.7 | 162.3 | 188.5 |
| Depreciation, % | 9.45 | 5.47 | 3.14 | 4.46 | 4.59 | 5.42 | 5.42 | 5.42 | 5.42 | 5.42 |
| EBIT | -177.3 | -63.6 | 643.9 | 189.6 | 52.5 | 77.9 | 90.5 | 105.1 | 122.1 | 141.8 |
| EBIT, % | -15.49 | -3.57 | 24.79 | 11.49 | 3.2 | 4.08 | 4.08 | 4.08 | 4.08 | 4.08 |
| Total Cash | 103.7 | 114.5 | 317.9 | 136.5 | 138.5 | 169.7 | 197.1 | 228.9 | 265.9 | 308.9 |
| Total Cash, percent | .0 | .0 | .0 | .0 | .0 | .0 | .0 | .0 | .0 | .0 |
| Account Receivables | 268.1 | 394.8 | 440.2 | 334.7 | 286.5 | 382.9 | 444.8 | 516.7 | 600.1 | 697.1 |
| Account Receivables, % | 23.42 | 22.19 | 16.94 | 20.28 | 17.43 | 20.05 | 20.05 | 20.05 | 20.05 | 20.05 |
| Inventories | 246.2 | 271.9 | 480.6 | 383.8 | 347.1 | 380.7 | 442.2 | 513.6 | 596.6 | 693.0 |
| Inventories, % | 21.52 | 15.28 | 18.5 | 23.26 | 21.12 | 19.94 | 19.94 | 19.94 | 19.94 | 19.94 |
| Accounts Payable | 147.5 | 201.0 | 219.0 | 182.9 | 157.9 | 203.6 | 236.5 | 274.7 | 319.1 | 370.6 |
| Accounts Payable, % | 12.89 | 11.3 | 8.43 | 11.09 | 9.6 | 10.66 | 10.66 | 10.66 | 10.66 | 10.66 |
| Capital Expenditure | -32.9 | -27.6 | -53.3 | -86.5 | -76.2 | -62.4 | -72.5 | -84.3 | -97.9 | -113.7 |
| Capital Expenditure, % | -2.88 | -1.55 | -2.05 | -5.24 | -4.63 | -3.27 | -3.27 | -3.27 | -3.27 | -3.27 |
| Tax Rate, % | 36.47 | 36.47 | 36.47 | 36.47 | 36.47 | 36.47 | 36.47 | 36.47 | 36.47 | 36.47 |
| EBITAT | -196.4 | -58.6 | 479.1 | 100.4 | 33.4 | 59.7 | 69.4 | 80.6 | 93.6 | 108.7 |
| Depreciation | ||||||||||
| Changes in Account Receivables | ||||||||||
| Changes in Inventories | ||||||||||
| Changes in Accounts Payable | ||||||||||
| Capital Expenditure | ||||||||||
| UFCF | -487.9 | -87.8 | 271.3 | 253.6 | 92.5 | 16.5 | 26.6 | 30.9 | 35.9 | 41.7 |
| WACC, % | 8.76 | 8.63 | 8.33 | 7.97 | 8.15 | 8.36 | 8.36 | 8.36 | 8.36 | 8.36 |
| PV UFCF | ||||||||||
| SUM PV UFCF | 116.1 | |||||||||
| Long Term Growth Rate, % | 0.50 | |||||||||
| Free cash flow (T + 1) | 42 | |||||||||
| Terminal Value | 533 | |||||||||
| Present Terminal Value | 357 | |||||||||
| Enterprise Value | 473 | |||||||||
| Net Debt | 66 | |||||||||
| Equity Value | 407 | |||||||||
| Diluted Shares Outstanding, MM | 189 | |||||||||
| Equity Value Per Share | 2.15 |
What You Will Get
- Real Ferroglobe Data: Preloaded financials – from revenue to EBIT – based on actual and projected figures.
- Full Customization: Adjust all critical parameters (yellow cells) like WACC, growth %, and tax rates.
- Instant Valuation Updates: Automatic recalculations to analyze the impact of changes on Ferroglobe’s fair value.
- Versatile Excel Template: Tailored for quick edits, scenario testing, and detailed projections.
- Time-Saving and Accurate: Skip building models from scratch while maintaining precision and flexibility.
Key Features
- Comprehensive DCF Calculator: Features detailed unlevered and levered DCF valuation models tailored for Ferroglobe PLC (GSM).
- WACC Calculator: A pre-configured Weighted Average Cost of Capital sheet with adjustable inputs specific to Ferroglobe PLC (GSM).
- Customizable Forecast Assumptions: Easily adjust growth rates, capital expenditures, and discount rates for accurate projections.
- Integrated Financial Ratios: Evaluate profitability, leverage, and efficiency ratios pertinent to Ferroglobe PLC (GSM).
- Visual Dashboard and Charts: Graphical representations summarize essential valuation metrics for straightforward analysis.
How It Works
- Step 1: Download the prebuilt Excel template featuring Ferroglobe PLC’s (GSM) data.
- Step 2: Navigate through the pre-filled sheets to familiarize yourself with the essential metrics.
- Step 3: Modify forecasts and assumptions in the editable yellow cells (WACC, growth, margins).
- Step 4: Instantly see the recalculated results, including Ferroglobe PLC’s (GSM) intrinsic value.
- Step 5: Utilize the outputs to make informed investment decisions or create detailed reports.
Why Choose This Calculator?
- Accurate Data: Real Ferroglobe PLC (GSM) financials ensure reliable valuation results.
- Customizable: Adjust key parameters like growth rates, WACC, and tax rates to match your projections.
- Time-Saving: Pre-built calculations eliminate the need to start from scratch.
- Professional-Grade Tool: Designed for investors, analysts, and consultants.
- User-Friendly: Intuitive layout and step-by-step instructions make it easy for all users.
Who Should Use This Product?
- Professional Investors: Create comprehensive and accurate valuation models for portfolio assessment.
- Corporate Finance Teams: Evaluate valuation scenarios to shape internal strategies.
- Consultants and Advisors: Deliver clients precise valuation insights for Ferroglobe PLC (GSM).
- Students and Educators: Utilize real-time data to practice and teach financial modeling techniques.
- Industry Analysts: Gain insights into how companies like Ferroglobe PLC (GSM) are valued in the marketplace.
What the Template Contains
- Pre-Filled DCF Model: Ferroglobe PLC’s (GSM) financial data preloaded for immediate use.
- WACC Calculator: Detailed calculations for Weighted Average Cost of Capital specific to Ferroglobe PLC (GSM).
- Financial Ratios: Evaluate Ferroglobe PLC’s (GSM) profitability, leverage, and efficiency metrics.
- Editable Inputs: Change assumptions such as growth, margins, and CAPEX to fit your scenarios for Ferroglobe PLC (GSM).
- Financial Statements: Annual and quarterly reports to support detailed analysis of Ferroglobe PLC (GSM).
- Interactive Dashboard: Easily visualize key valuation metrics and results for Ferroglobe PLC (GSM).
Disclaimer
All information, articles, and product details provided on this website are for general informational and educational purposes only. We do not claim any ownership over, nor do we intend to infringe upon, any trademarks, copyrights, logos, brand names, or other intellectual property mentioned or depicted on this site. Such intellectual property remains the property of its respective owners, and any references here are made solely for identification or informational purposes, without implying any affiliation, endorsement, or partnership.
We make no representations or warranties, express or implied, regarding the accuracy, completeness, or suitability of any content or products presented. Nothing on this website should be construed as legal, tax, investment, financial, medical, or other professional advice. In addition, no part of this site—including articles or product references—constitutes a solicitation, recommendation, endorsement, advertisement, or offer to buy or sell any securities, franchises, or other financial instruments, particularly in jurisdictions where such activity would be unlawful.
All content is of a general nature and may not address the specific circumstances of any individual or entity. It is not a substitute for professional advice or services. Any actions you take based on the information provided here are strictly at your own risk. You accept full responsibility for any decisions or outcomes arising from your use of this website and agree to release us from any liability in connection with your use of, or reliance upon, the content or products found herein.