
|
Gaztransport & Technigaz SA (GTT.PA) DCF Valoración |
Completamente Editable: Adáptelo A Sus Necesidades En Excel O Sheets
Diseño Profesional: Plantillas Confiables Y Estándares De La Industria
Predeterminadas Para Un Uso Rápido Y Eficiente
Compatible con MAC / PC, completamente desbloqueado
No Se Necesita Experiencia; Fáciles De Seguir
Gaztransport & Technigaz SA (GTT.PA) Bundle
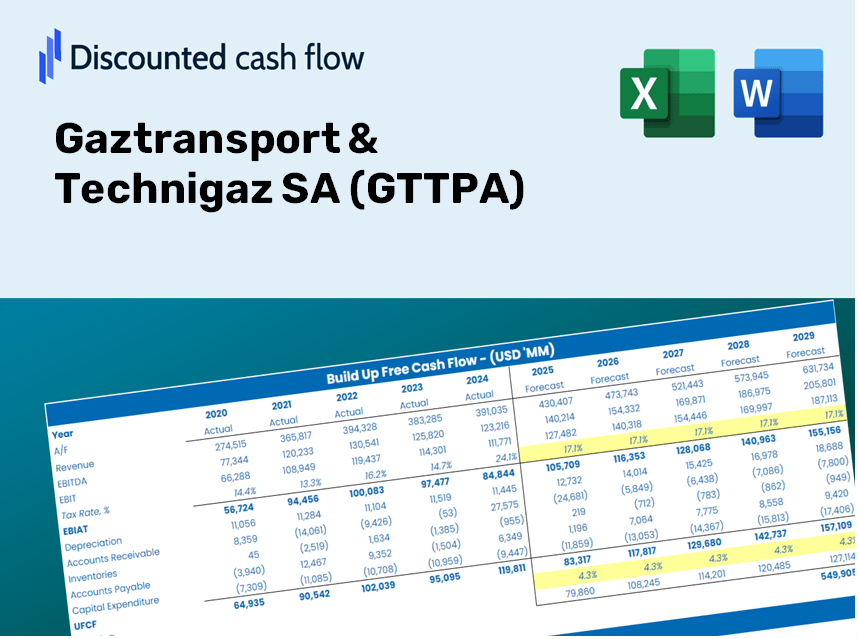
Diseñada para la precisión, nuestra calculadora DCF (GTTPA) le permite evaluar Gaztransport & La valoración de Technigaz SA utilizando datos financieros actualizados, que ofrece una flexibilidad completa para modificar todos los parámetros esenciales para proyecciones mejoradas.
Discounted Cash Flow (DCF) - (USD MM)
| Year | AY1 2020 |
AY2 2021 |
AY3 2022 |
AY4 2023 |
AY5 2024 |
FY1 2025 |
FY2 2026 |
FY3 2027 |
FY4 2028 |
FY5 2029 |
|---|---|---|---|---|---|---|---|---|---|---|
| Revenue | 396.4 | 314.7 | 307.3 | 427.7 | 641.4 | 747.5 | 871.2 | 1,015.3 | 1,183.3 | 1,379.1 |
| Revenue Growth, % | 0 | -20.6 | -2.36 | 39.18 | 49.96 | 16.55 | 16.55 | 16.55 | 16.55 | 16.55 |
| EBITDA | 242.6 | 172.2 | 161.1 | 243.4 | 389.0 | 427.4 | 498.1 | 580.6 | 676.6 | 788.6 |
| EBITDA, % | 61.21 | 54.7 | 52.42 | 56.91 | 60.65 | 57.18 | 57.18 | 57.18 | 57.18 | 57.18 |
| Depreciation | 5.8 | 7.6 | 8.9 | 10.6 | 14.7 | 17.2 | 20.1 | 23.4 | 27.3 | 31.8 |
| Depreciation, % | 1.48 | 2.4 | 2.89 | 2.48 | 2.28 | 2.31 | 2.31 | 2.31 | 2.31 | 2.31 |
| EBIT | 236.8 | 164.6 | 152.2 | 232.8 | 374.3 | 410.2 | 478.0 | 557.1 | 649.3 | 756.8 |
| EBIT, % | 59.74 | 52.3 | 49.53 | 54.43 | 58.37 | 54.87 | 54.87 | 54.87 | 54.87 | 54.87 |
| Total Cash | 141.7 | 203.8 | 212.8 | 267.7 | 343.7 | 427.5 | 498.2 | 580.6 | 676.7 | 788.7 |
| Total Cash, percent | .0 | .0 | .0 | .0 | .0 | .0 | .0 | .0 | .0 | .0 |
| Account Receivables | 104.4 | 70.8 | 117.9 | 158.1 | 186.0 | 229.0 | 266.9 | 311.0 | 362.5 | 422.5 |
| Account Receivables, % | 26.33 | 22.48 | 38.38 | 36.96 | 29 | 30.63 | 30.63 | 30.63 | 30.63 | 30.63 |
| Inventories | 10.7 | 9.6 | 13.6 | 19.7 | 29.8 | 29.0 | 33.8 | 39.4 | 46.0 | 53.6 |
| Inventories, % | 2.69 | 3.05 | 4.43 | 4.62 | 4.64 | 3.89 | 3.89 | 3.89 | 3.89 | 3.89 |
| Accounts Payable | 18.2 | 21.6 | 23.8 | 32.4 | 44.6 | 50.3 | 58.7 | 68.4 | 79.7 | 92.9 |
| Accounts Payable, % | 4.58 | 6.85 | 7.73 | 7.57 | 6.95 | 6.74 | 6.74 | 6.74 | 6.74 | 6.74 |
| Capital Expenditure | -13.7 | -16.1 | -20.5 | -43.1 | -61.7 | -52.2 | -60.9 | -71.0 | -82.7 | -96.4 |
| Capital Expenditure, % | -3.47 | -5.1 | -6.68 | -10.08 | -9.62 | -6.99 | -6.99 | -6.99 | -6.99 | -6.99 |
| Tax Rate, % | 14.51 | 14.51 | 14.51 | 14.51 | 14.51 | 14.51 | 14.51 | 14.51 | 14.51 | 14.51 |
| EBITAT | 199.4 | 133.9 | 127.8 | 198.4 | 320.0 | 344.8 | 401.8 | 468.3 | 545.8 | 636.1 |
| Depreciation | ||||||||||
| Changes in Account Receivables | ||||||||||
| Changes in Inventories | ||||||||||
| Changes in Accounts Payable | ||||||||||
| Capital Expenditure | ||||||||||
| UFCF | 94.7 | 163.5 | 67.2 | 128.2 | 247.2 | 273.4 | 326.7 | 380.7 | 443.7 | 517.2 |
| WACC, % | 5.38 | 5.38 | 5.38 | 5.38 | 5.38 | 5.38 | 5.38 | 5.38 | 5.38 | 5.38 |
| PV UFCF | ||||||||||
| SUM PV UFCF | 1,636.8 | |||||||||
| Long Term Growth Rate, % | 2.00 | |||||||||
| Free cash flow (T + 1) | 527 | |||||||||
| Terminal Value | 15,615 | |||||||||
| Present Terminal Value | 12,017 | |||||||||
| Enterprise Value | 13,653 | |||||||||
| Net Debt | -327 | |||||||||
| Equity Value | 13,981 | |||||||||
| Diluted Shares Outstanding, MM | 37 | |||||||||
| Equity Value Per Share | 376.47 |
What You Will Receive
- Customizable Excel Template: A fully adaptable Excel-based DCF Calculator featuring pre-filled financial data for GTTPA.
- Relevant Data: Access to historical figures and future projections (highlighted in the yellow cells).
- Flexible Forecasting: Adjust forecast parameters such as revenue growth, EBITDA percentage, and WACC.
- Instant Calculations: Quickly observe how your inputs influence the valuation of Gaztransport & Technigaz (GTTPA).
- Professional Resource: Designed for investors, CFOs, consultants, and financial analysts.
- Intuitive Layout: Organized for straightforward navigation and user-friendliness, complete with step-by-step instructions.
Key Features
- Customizable Forecast Inputs: Adjust essential parameters such as revenue growth, EBITDA margin, and capital expenditures.
- Instant DCF Valuation: Automatically computes intrinsic value, NPV, and various financial metrics within moments.
- High Precision Accuracy: Leverages Gaztransport & Technigaz SA’s (GTTPA) real-world financial data for reliable valuation results.
- Simplified Scenario Analysis: Effortlessly explore different assumptions and assess outcomes side by side.
- Efficiency Booster: Remove the hassle of creating complex valuation models from the ground up.
How It Functions
- Step 1: Download the Excel file.
- Step 2: Review the pre-filled data for Gaztransport & Technigaz SA (GTTPA) (historical and projected).
- Step 3: Modify key assumptions (highlighted in yellow) according to your analysis.
- Step 4: Observe the automatic recalculations for Gaztransport & Technigaz SA's intrinsic value.
- Step 5: Utilize the results for your investment decisions or reporting needs.
Why Opt for This Calculator?
- All-in-One Solution: Incorporates DCF, WACC, and financial ratio analysis into a single platform.
- Flexible Inputs: Modify the highlighted cells to explore different financial scenarios.
- In-Depth Analysis: Automatically computes the intrinsic value and Net Present Value for Gaztransport & Technigaz SA (GTTPA).
- Ready-to-Use Data: Comes with historical and projected data for reliable initial assessments.
- High-Quality Standard: Perfect for financial analysts, investors, and business consultants focused on GTTPA.
Who Can Benefit from Gaztransport & Technigaz SA (GTTPA)?
- Investors: Make informed investment choices with our cutting-edge valuation insights.
- Financial Analysts: Streamline your analysis with a customizable DCF model at your fingertips.
- Consultants: Effortlessly modify templates for engaging client presentations and reports.
- Finance Enthusiasts: Enhance your knowledge of valuation methods through practical examples and case studies.
- Academics and Students: Leverage our resources as an effective learning aid in finance-related studies.
Contents of the Template
- Pre-Filled Data: Contains historical financial data and projections for Gaztransport & Technigaz SA (GTTPA).
- Discounted Cash Flow Model: An editable DCF valuation model featuring automatic calculations.
- Weighted Average Cost of Capital (WACC): A dedicated worksheet to compute WACC using customizable inputs.
- Key Financial Ratios: Evaluate the profitability, efficiency, and leverage of Gaztransport & Technigaz SA (GTTPA).
- Customizable Inputs: Easily modify revenue growth, profit margins, and tax rates.
- Clear Dashboard: Visual representations and tables summarizing essential valuation outcomes.
Disclaimer
All information, articles, and product details provided on this website are for general informational and educational purposes only. We do not claim any ownership over, nor do we intend to infringe upon, any trademarks, copyrights, logos, brand names, or other intellectual property mentioned or depicted on this site. Such intellectual property remains the property of its respective owners, and any references here are made solely for identification or informational purposes, without implying any affiliation, endorsement, or partnership.
We make no representations or warranties, express or implied, regarding the accuracy, completeness, or suitability of any content or products presented. Nothing on this website should be construed as legal, tax, investment, financial, medical, or other professional advice. In addition, no part of this site—including articles or product references—constitutes a solicitation, recommendation, endorsement, advertisement, or offer to buy or sell any securities, franchises, or other financial instruments, particularly in jurisdictions where such activity would be unlawful.
All content is of a general nature and may not address the specific circumstances of any individual or entity. It is not a substitute for professional advice or services. Any actions you take based on the information provided here are strictly at your own risk. You accept full responsibility for any decisions or outcomes arising from your use of this website and agree to release us from any liability in connection with your use of, or reliance upon, the content or products found herein.