
|
Valoración DCF de Hyatt Hotels Corporation (H) |
Completamente Editable: Adáptelo A Sus Necesidades En Excel O Sheets
Diseño Profesional: Plantillas Confiables Y Estándares De La Industria
Predeterminadas Para Un Uso Rápido Y Eficiente
Compatible con MAC / PC, completamente desbloqueado
No Se Necesita Experiencia; Fáciles De Seguir
Hyatt Hotels Corporation (H) Bundle
¡Mejore su estrategia de inversión con la calculadora DCF de Hyatt Hotels Corporation (H)! Utilice las finanzas reales de Hyatt, ajuste las proyecciones y gastos de crecimiento, y observe instantáneamente cómo estas alteraciones afectan el valor intrínseco de Hyatt Hotels Corporation (H).
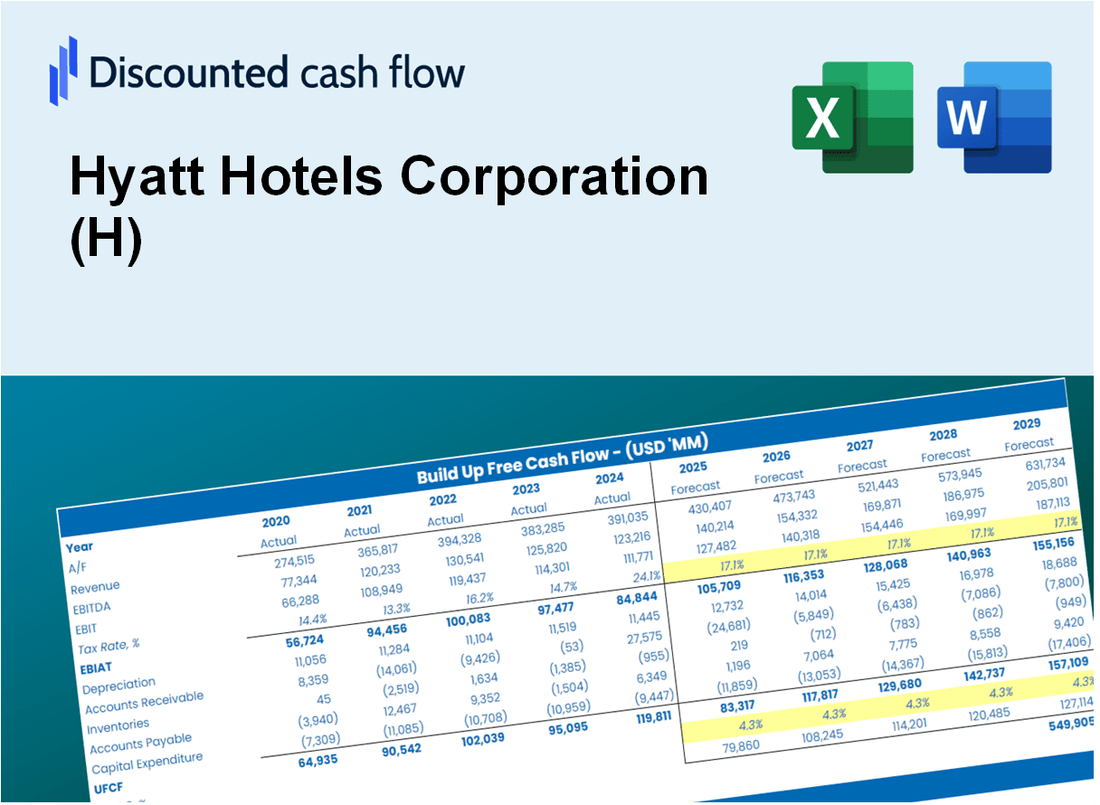
Discounted Cash Flow (DCF) - (USD MM)
| Year | AY1 2020 |
AY2 2021 |
AY3 2022 |
AY4 2023 |
AY5 2024 |
FY1 2025 |
FY2 2026 |
FY3 2027 |
FY4 2028 |
FY5 2029 |
|---|---|---|---|---|---|---|---|---|---|---|
| Revenue | 780.0 | 1,445.0 | 3,271.0 | 3,609.0 | 3,296.0 | 4,836.2 | 7,096.1 | 10,412.1 | 15,277.5 | 22,416.6 |
| Revenue Growth, % | 0 | 85.26 | 126.37 | 10.33 | -8.67 | 46.73 | 46.73 | 46.73 | 46.73 | 46.73 |
| EBITDA | -322.0 | 59.0 | 853.0 | 728.0 | 749.0 | 307.3 | 451.0 | 661.7 | 970.9 | 1,424.6 |
| EBITDA, % | -41.28 | 4.08 | 26.08 | 20.17 | 22.72 | 6.35 | 6.35 | 6.35 | 6.35 | 6.35 |
| Depreciation | 310.0 | 310.0 | 426.0 | 397.0 | 333.0 | 922.0 | 1,352.9 | 1,985.0 | 2,912.6 | 4,273.7 |
| Depreciation, % | 39.74 | 21.45 | 13.02 | 11 | 10.1 | 19.06 | 19.06 | 19.06 | 19.06 | 19.06 |
| EBIT | -632.0 | -251.0 | 427.0 | 331.0 | 416.0 | -614.7 | -901.9 | -1,323.4 | -1,941.7 | -2,849.1 |
| EBIT, % | -81.03 | -17.37 | 13.05 | 9.17 | 12.62 | -12.71 | -12.71 | -12.71 | -12.71 | -12.71 |
| Total Cash | 1,882.0 | 1,187.0 | 1,149.0 | 896.0 | 1,383.0 | 2,747.5 | 4,031.4 | 5,915.3 | 8,679.4 | 12,735.3 |
| Total Cash, percent | .0 | .0 | .0 | .0 | .0 | .0 | .0 | .0 | .0 | .0 |
| Account Receivables | 316.0 | 633.0 | 834.0 | 883.0 | 1,121.0 | 1,627.8 | 2,388.5 | 3,504.6 | 5,142.2 | 7,545.1 |
| Account Receivables, % | 40.51 | 43.81 | 25.5 | 24.47 | 34.01 | 33.66 | 33.66 | 33.66 | 33.66 | 33.66 |
| Inventories | 9.0 | 10.0 | 9.0 | 9.0 | 8.0 | 25.3 | 37.1 | 54.4 | 79.8 | 117.2 |
| Inventories, % | 1.15 | 0.69204 | 0.27515 | 0.24938 | 0.24272 | 0.52263 | 0.52263 | 0.52263 | 0.52263 | 0.52263 |
| Accounts Payable | 102.0 | 523.0 | 500.0 | 493.0 | 475.0 | 895.9 | 1,314.6 | 1,928.9 | 2,830.3 | 4,152.8 |
| Accounts Payable, % | 13.08 | 36.19 | 15.29 | 13.66 | 14.41 | 18.53 | 18.53 | 18.53 | 18.53 | 18.53 |
| Capital Expenditure | -122.0 | -111.0 | -201.0 | -198.0 | -170.0 | -388.0 | -569.3 | -835.3 | -1,225.6 | -1,798.3 |
| Capital Expenditure, % | -15.64 | -7.68 | -6.14 | -5.49 | -5.16 | -8.02 | -8.02 | -8.02 | -8.02 | -8.02 |
| Tax Rate, % | 17.08 | 17.08 | 17.08 | 17.08 | 17.08 | 17.08 | 17.08 | 17.08 | 17.08 | 17.08 |
| EBITAT | -462.8 | 1,266.4 | 535.2 | 234.9 | 344.9 | -402.1 | -590.0 | -865.8 | -1,270.3 | -1,864.0 |
| Depreciation | ||||||||||
| Changes in Account Receivables | ||||||||||
| Changes in Inventories | ||||||||||
| Changes in Accounts Payable | ||||||||||
| Capital Expenditure | ||||||||||
| UFCF | -497.8 | 1,568.4 | 537.2 | 377.9 | 252.9 | 28.8 | -160.3 | -235.2 | -345.1 | -506.3 |
| WACC, % | 8.42 | 7.85 | 8.62 | 8.4 | 8.49 | 8.36 | 8.36 | 8.36 | 8.36 | 8.36 |
| PV UFCF | ||||||||||
| SUM PV UFCF | -884.0 | |||||||||
| Long Term Growth Rate, % | 3.50 | |||||||||
| Free cash flow (T + 1) | -524 | |||||||||
| Terminal Value | -10,789 | |||||||||
| Present Terminal Value | -7,223 | |||||||||
| Enterprise Value | -8,107 | |||||||||
| Net Debt | 3,049 | |||||||||
| Equity Value | -11,156 | |||||||||
| Diluted Shares Outstanding, MM | 102 | |||||||||
| Equity Value Per Share | -108.92 |
What You Will Get
- Real H Financial Data: Pre-filled with Hyatt’s historical and projected data for accurate analysis.
- Fully Editable Template: Easily modify key inputs such as occupancy rates, average daily rate, and revenue per available room.
- Automatic Calculations: View Hyatt’s intrinsic value update in real-time based on your adjustments.
- Professional Valuation Tool: Tailored for investors, analysts, and consultants seeking reliable DCF results.
- User-Friendly Design: Intuitive layout and straightforward instructions suitable for all skill levels.
Key Features
- 🔍 Real-Life H Financials: Pre-filled historical and projected data for Hyatt Hotels Corporation.
- ✏️ Fully Customizable Inputs: Adjust all critical parameters (yellow cells) like WACC, growth %, and tax rates.
- 📊 Professional DCF Valuation: Built-in formulas calculate Hyatt’s intrinsic value using the Discounted Cash Flow method.
- ⚡ Instant Results: Visualize Hyatt’s valuation instantly after making changes.
- Scenario Analysis: Test and compare outcomes for various financial assumptions side-by-side.
How It Works
- Download the Template: Get immediate access to the Excel-based Hyatt Hotels (H) DCF Calculator.
- Input Your Assumptions: Modify the yellow-highlighted cells for growth rates, WACC, margins, and other variables.
- Instant Calculations: The model automatically recalculates Hyatt's intrinsic value.
- Test Scenarios: Experiment with different assumptions to assess potential valuation impacts.
- Analyze and Decide: Leverage the results to inform your investment or financial analysis.
Why Choose This Calculator?
- Accurate Data: Real Hyatt Hotels Corporation (H) financials ensure reliable valuation results.
- Customizable: Adjust key parameters like growth rates, WACC, and tax rates to match your projections.
- Time-Saving: Pre-built calculations eliminate the need to start from scratch.
- Professional-Grade Tool: Designed for investors, analysts, and consultants.
- User-Friendly: Intuitive layout and step-by-step instructions make it easy for all users.
Who Should Use Hyatt Hotels Corporation (H)?
- Travel Enthusiasts: Discover a wide range of accommodations to enhance your travel experience.
- Business Travelers: Benefit from convenient locations and amenities tailored for productivity.
- Event Planners: Utilize our venues for seamless meetings and special events.
- Families: Enjoy family-friendly services and facilities for a memorable stay.
- Investors: Analyze the hospitality market with insights from a leading hotel brand.
What the Template Contains
- Operating and Balance Sheet Data: Pre-filled Hyatt Hotels Corporation (H) historical data and forecasts, including revenue, EBITDA, EBIT, and capital expenditures.
- WACC Calculation: A dedicated sheet for Weighted Average Cost of Capital (WACC), including parameters like Beta, risk-free rate, and share price.
- DCF Valuation (Unlevered and Levered): Editable Discounted Cash Flow models showing intrinsic value with detailed calculations.
- Financial Statements: Pre-loaded financial statements (annual and quarterly) to support analysis.
- Key Ratios: Includes profitability, leverage, and efficiency ratios for Hyatt Hotels Corporation (H).
- Dashboard and Charts: Visual summary of valuation outputs and assumptions to analyze results easily.
Disclaimer
All information, articles, and product details provided on this website are for general informational and educational purposes only. We do not claim any ownership over, nor do we intend to infringe upon, any trademarks, copyrights, logos, brand names, or other intellectual property mentioned or depicted on this site. Such intellectual property remains the property of its respective owners, and any references here are made solely for identification or informational purposes, without implying any affiliation, endorsement, or partnership.
We make no representations or warranties, express or implied, regarding the accuracy, completeness, or suitability of any content or products presented. Nothing on this website should be construed as legal, tax, investment, financial, medical, or other professional advice. In addition, no part of this site—including articles or product references—constitutes a solicitation, recommendation, endorsement, advertisement, or offer to buy or sell any securities, franchises, or other financial instruments, particularly in jurisdictions where such activity would be unlawful.
All content is of a general nature and may not address the specific circumstances of any individual or entity. It is not a substitute for professional advice or services. Any actions you take based on the information provided here are strictly at your own risk. You accept full responsibility for any decisions or outcomes arising from your use of this website and agree to release us from any liability in connection with your use of, or reliance upon, the content or products found herein.