
|
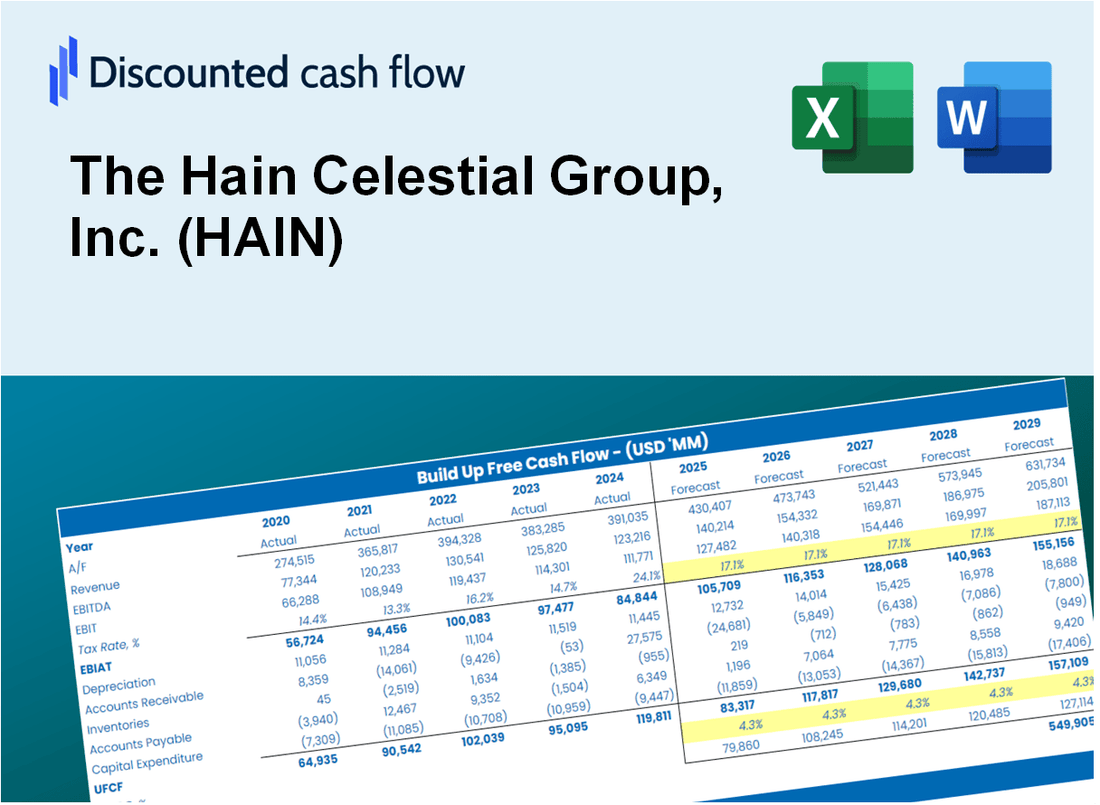
La valoración DCF del Grupo Hain Celestial, Inc. (HAIN) |
Completamente Editable: Adáptelo A Sus Necesidades En Excel O Sheets
Diseño Profesional: Plantillas Confiables Y Estándares De La Industria
Predeterminadas Para Un Uso Rápido Y Eficiente
Compatible con MAC / PC, completamente desbloqueado
No Se Necesita Experiencia; Fáciles De Seguir
The Hain Celestial Group, Inc. (HAIN) Bundle
¡Maximice la eficiencia y mejore la precisión con nuestra calculadora DCF (hain)! Utilizando datos reales de Hain Celestial Group, Inc. y suposiciones personalizables, esta poderosa herramienta le permite pronosticar, analizar y evaluar (HAIN) al igual que un inversor experimentado.
What You Will Receive
- Pre-Filled Financial Model: Hain Celestial's actual data facilitates accurate DCF valuation.
- Complete Forecast Control: Modify revenue growth, profit margins, WACC, and other essential factors.
- Instantaneous Calculations: Automatic updates provide immediate results as adjustments are made.
- Investor-Ready Template: A polished Excel file crafted for high-quality valuation.
- Customizable and Reusable: Designed for adaptability, allowing for repeated use in comprehensive forecasting.
Key Features
- Comprehensive DCF Calculator: Offers intricate unlevered and levered DCF valuation models tailored for The Hain Celestial Group, Inc. (HAIN).
- WACC Calculator: Features a pre-configured Weighted Average Cost of Capital sheet with adjustable inputs.
- Customizable Forecast Assumptions: Adjust growth rates, capital expenditures, and discount rates as needed.
- Integrated Financial Ratios: Evaluate profitability, leverage, and efficiency ratios specific to The Hain Celestial Group, Inc. (HAIN).
- Interactive Dashboard and Charts: Visual representations summarize essential valuation metrics for straightforward analysis.
How It Works
- Download the Template: Gain immediate access to the Excel-based HAIN DCF Calculator.
- Input Your Assumptions: Modify the yellow-highlighted cells for growth rates, WACC, margins, and other variables.
- Instant Calculations: The model automatically recalculates Hain Celestial's intrinsic value.
- Test Scenarios: Experiment with different assumptions to assess potential valuation fluctuations.
- Analyze and Decide: Utilize the results to inform your investment or financial analysis.
Why Choose This Calculator for The Hain Celestial Group, Inc. (HAIN)?
- Accuracy: Utilizes authentic Hain Celestial financials to ensure precise data.
- Flexibility: Built to allow users to experiment and adjust inputs as needed.
- Time-Saving: Avoid the complexities of constructing a DCF model from the ground up.
- Professional-Grade: Crafted with the precision and functionality expected by CFOs.
- User-Friendly: Intuitive design makes it accessible for users without extensive financial modeling skills.
Who Should Use The Hain Celestial Group, Inc. (HAIN)?
- Investors: Gain insights into sustainable food and personal care investments with our comprehensive analysis.
- Market Analysts: Utilize detailed reports to evaluate market trends and performance metrics.
- Consultants: Tailor our resources for client strategies in the health and wellness sector.
- Health-Conscious Consumers: Explore our product offerings to make informed choices for a healthier lifestyle.
- Students and Educators: Leverage our case studies to enhance learning in business and sustainability courses.
What the Template Contains
- Preloaded HAIN Data: Historical and projected financial data, including revenue, EBIT, and capital expenditures.
- DCF and WACC Models: Professional-grade sheets for calculating intrinsic value and Weighted Average Cost of Capital.
- Editable Inputs: Yellow-highlighted cells for adjusting revenue growth, tax rates, and discount rates.
- Financial Statements: Comprehensive annual and quarterly financials for deeper analysis.
- Key Ratios: Profitability, leverage, and efficiency ratios to evaluate performance.
- Dashboard and Charts: Visual summaries of valuation outcomes and assumptions.
Disclaimer
All information, articles, and product details provided on this website are for general informational and educational purposes only. We do not claim any ownership over, nor do we intend to infringe upon, any trademarks, copyrights, logos, brand names, or other intellectual property mentioned or depicted on this site. Such intellectual property remains the property of its respective owners, and any references here are made solely for identification or informational purposes, without implying any affiliation, endorsement, or partnership.
We make no representations or warranties, express or implied, regarding the accuracy, completeness, or suitability of any content or products presented. Nothing on this website should be construed as legal, tax, investment, financial, medical, or other professional advice. In addition, no part of this site—including articles or product references—constitutes a solicitation, recommendation, endorsement, advertisement, or offer to buy or sell any securities, franchises, or other financial instruments, particularly in jurisdictions where such activity would be unlawful.
All content is of a general nature and may not address the specific circumstances of any individual or entity. It is not a substitute for professional advice or services. Any actions you take based on the information provided here are strictly at your own risk. You accept full responsibility for any decisions or outcomes arising from your use of this website and agree to release us from any liability in connection with your use of, or reliance upon, the content or products found herein.