
|
Valoración de DCF HBL Power Systems Limited (HBLPower.NS) |
Completamente Editable: Adáptelo A Sus Necesidades En Excel O Sheets
Diseño Profesional: Plantillas Confiables Y Estándares De La Industria
Predeterminadas Para Un Uso Rápido Y Eficiente
Compatible con MAC / PC, completamente desbloqueado
No Se Necesita Experiencia; Fáciles De Seguir
HBL Power Systems Limited (HBLPOWER.NS) Bundle
¡Explore el futuro financiero de HBL Power Systems Limited (HBLPowerns) con nuestra calculadora DCF fácil de usar! Ingrese sus suposiciones con respecto a las tasas de crecimiento, los márgenes de beneficio y los gastos para calcular el valor intrínseco de HBL Power Systems Limited (HBLPowerns) y refinar su estrategia de inversión.
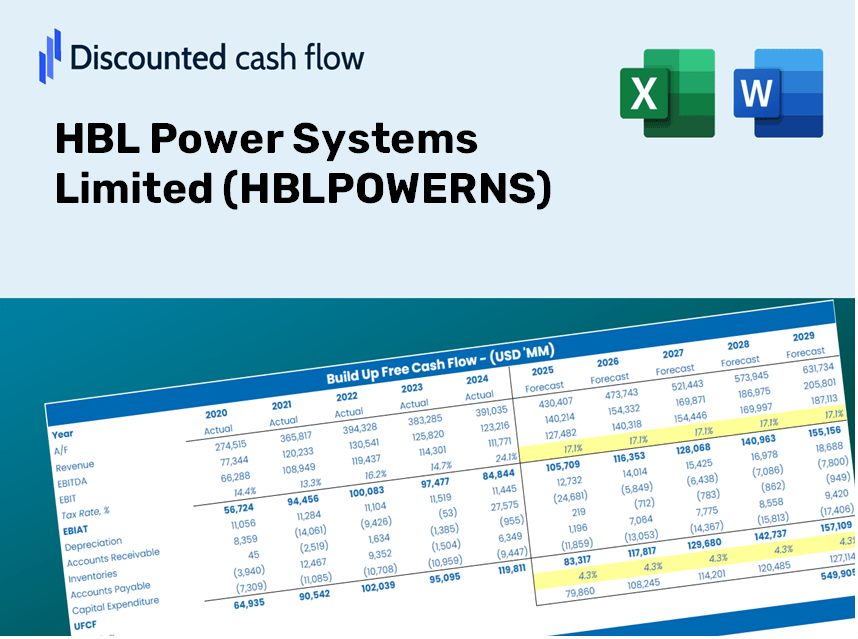
Discounted Cash Flow (DCF) - (USD MM)
| Year | AY1 2019 |
AY2 2020 |
AY3 2021 |
AY4 2022 |
AY5 2023 |
FY1 2024 |
FY2 2025 |
FY3 2026 |
FY4 2027 |
FY5 2028 |
|---|---|---|---|---|---|---|---|---|---|---|
| Revenue | 10,807.2 | 8,941.7 | 12,125.7 | 13,576.4 | 22,333.6 | 27,627.3 | 34,175.9 | 42,276.7 | 52,297.7 | 64,694.0 |
| Revenue Growth, % | 0 | -17.26 | 35.61 | 11.96 | 64.5 | 23.7 | 23.7 | 23.7 | 23.7 | 23.7 |
| EBITDA | 1,020.1 | 716.0 | 1,641.3 | 1,704.5 | 4,273.0 | 3,462.9 | 4,283.7 | 5,299.0 | 6,555.1 | 8,108.9 |
| EBITDA, % | 9.44 | 8.01 | 13.54 | 12.56 | 19.13 | 12.53 | 12.53 | 12.53 | 12.53 | 12.53 |
| Depreciation | 407.5 | 388.1 | 351.3 | 354.6 | 412.6 | 854.7 | 1,057.2 | 1,307.8 | 1,617.8 | 2,001.3 |
| Depreciation, % | 3.77 | 4.34 | 2.9 | 2.61 | 1.85 | 3.09 | 3.09 | 3.09 | 3.09 | 3.09 |
| EBIT | 612.6 | 327.9 | 1,290.0 | 1,349.9 | 3,860.5 | 2,608.2 | 3,226.4 | 3,991.2 | 4,937.3 | 6,107.5 |
| EBIT, % | 5.67 | 3.67 | 10.64 | 9.94 | 17.29 | 9.44 | 9.44 | 9.44 | 9.44 | 9.44 |
| Total Cash | 459.2 | 531.0 | 896.0 | 1,332.4 | 2,289.2 | 2,079.9 | 2,572.9 | 3,182.7 | 3,937.1 | 4,870.3 |
| Total Cash, percent | .0 | .0 | .0 | .0 | .0 | .0 | .0 | .0 | .0 | .0 |
| Account Receivables | 3,208.5 | .0 | .0 | 3,261.0 | 4,056.5 | 3,971.2 | 4,912.5 | 6,076.9 | 7,517.4 | 9,299.2 |
| Account Receivables, % | 29.69 | 0 | 0 | 24.02 | 18.16 | 14.37 | 14.37 | 14.37 | 14.37 | 14.37 |
| Inventories | 3,043.2 | 2,898.6 | 3,070.3 | 3,362.5 | 4,501.3 | 7,228.3 | 8,941.7 | 11,061.1 | 13,683.0 | 16,926.3 |
| Inventories, % | 28.16 | 32.42 | 25.32 | 24.77 | 20.16 | 26.16 | 26.16 | 26.16 | 26.16 | 26.16 |
| Accounts Payable | 780.9 | 673.4 | 755.3 | 982.7 | 1,304.9 | 1,882.4 | 2,328.5 | 2,880.5 | 3,563.3 | 4,407.9 |
| Accounts Payable, % | 7.23 | 7.53 | 6.23 | 7.24 | 5.84 | 6.81 | 6.81 | 6.81 | 6.81 | 6.81 |
| Capital Expenditure | -380.2 | -387.5 | -681.3 | -638.8 | -531.9 | -1,135.8 | -1,405.1 | -1,738.1 | -2,150.1 | -2,659.8 |
| Capital Expenditure, % | -3.52 | -4.33 | -5.62 | -4.71 | -2.38 | -4.11 | -4.11 | -4.11 | -4.11 | -4.11 |
| Tax Rate, % | 25.45 | 25.45 | 25.45 | 25.45 | 25.45 | 25.45 | 25.45 | 25.45 | 25.45 | 25.45 |
| EBITAT | 400.6 | 231.8 | 989.6 | 1,026.0 | 2,877.9 | 1,895.3 | 2,344.5 | 2,900.3 | 3,587.7 | 4,438.1 |
| Depreciation | ||||||||||
| Changes in Account Receivables | ||||||||||
| Changes in Inventories | ||||||||||
| Changes in Accounts Payable | ||||||||||
| Capital Expenditure | ||||||||||
| UFCF | -5,042.9 | 3,478.1 | 569.8 | -2,584.0 | 1,146.4 | -450.2 | -211.8 | -262.0 | -324.1 | -400.9 |
| WACC, % | 7.5 | 7.51 | 7.51 | 7.51 | 7.51 | 7.51 | 7.51 | 7.51 | 7.51 | 7.51 |
| PV UFCF | ||||||||||
| SUM PV UFCF | -1,334.4 | |||||||||
| Long Term Growth Rate, % | 2.00 | |||||||||
| Free cash flow (T + 1) | -409 | |||||||||
| Terminal Value | -7,421 | |||||||||
| Present Terminal Value | -5,167 | |||||||||
| Enterprise Value | -6,501 | |||||||||
| Net Debt | -1,560 | |||||||||
| Equity Value | -4,941 | |||||||||
| Diluted Shares Outstanding, MM | 277 | |||||||||
| Equity Value Per Share | -17.83 |
What You Will Receive
- Accurate HBL Financials: Access to historical data and projections for precise valuation.
- Customizable Inputs: Adjust WACC, tax rates, revenue growth, and capital expenditures as needed.
- Real-Time Calculations: Dynamic computation of intrinsic value and NPV.
- Scenario Analysis: Evaluate various scenarios to assess HBL Power Systems' future potential.
- User-Friendly Design: Designed for professionals, yet easy for newcomers to navigate.
Key Features
- Customizable Forecast Inputs: Adjust essential metrics such as revenue growth, EBITDA %, and capital expenditures to fit your analysis.
- Instant DCF Valuation: Automatically computes intrinsic value, NPV, and additional financial outputs with ease.
- High-Precision Accuracy: Leverages real data from HBL Power Systems Limited (HBLPOWERNS) for reliable valuation results.
- Simplified Scenario Analysis: Effortlessly explore various assumptions and evaluate their impacts on performance.
- Efficiency Booster: Streamlines the valuation process, eliminating the need for labor-intensive model building.
How It Operates
- Step 1: Download the Excel spreadsheet.
- Step 2: Examine the pre-filled data for HBL Power Systems Limited (HBLPOWERNS) covering both historical and projected figures.
- Step 3: Modify key assumptions (highlighted in yellow) according to your analysis.
- Step 4: Observe the automatic updates for HBL Power Systems Limited's intrinsic value.
- Step 5: Utilize the results for your investment strategies or reporting purposes.
Why Opt for This Calculator?
- Precision: Real HBL Power Systems Limited (HBLPOWERNS) financials guarantee data integrity.
- Versatility: Crafted to allow users to test and adjust inputs with ease.
- Efficiency: Eliminate the need to start a DCF model from the ground up.
- Expert-Level: Engineered with CFO-grade accuracy and functionality in consideration.
- Intuitive: Designed to be straightforward, even for those with limited financial modeling knowledge.
Who Can Benefit from HBL Power Systems Limited (HBLPOWERNS)?
- Institutional Investors: Develop comprehensive and trustworthy valuation models for portfolio evaluation.
- Corporate Finance Departments: Assess valuation scenarios to influence strategic decision-making.
- Consultants and Financial Advisors: Deliver clients precise valuation analyses for HBL Power Systems Limited (HBLPOWERNS).
- Students and Educators: Utilize real-world data to enhance financial modeling skills and education.
- Industry Enthusiasts: Gain insights into the market valuation of energy sector companies like HBL Power Systems Limited (HBLPOWERNS).
Contents of the Template
- Pre-Filled Data: Features HBL Power Systems Limited's historical financial information and projections.
- Discounted Cash Flow Model: Customizable DCF valuation model with automatic calculation functionalities.
- Weighted Average Cost of Capital (WACC): A specific sheet designed for WACC calculation based on user-defined inputs.
- Key Financial Ratios: Insights into HBL Power Systems Limited's profitability, operational efficiency, and financial leverage.
- Customizable Inputs: Easily modify assumptions for revenue growth, profit margins, and tax rates.
- Informative Dashboard: Visual representations and tables that encapsulate key valuation outcomes.
Disclaimer
All information, articles, and product details provided on this website are for general informational and educational purposes only. We do not claim any ownership over, nor do we intend to infringe upon, any trademarks, copyrights, logos, brand names, or other intellectual property mentioned or depicted on this site. Such intellectual property remains the property of its respective owners, and any references here are made solely for identification or informational purposes, without implying any affiliation, endorsement, or partnership.
We make no representations or warranties, express or implied, regarding the accuracy, completeness, or suitability of any content or products presented. Nothing on this website should be construed as legal, tax, investment, financial, medical, or other professional advice. In addition, no part of this site—including articles or product references—constitutes a solicitation, recommendation, endorsement, advertisement, or offer to buy or sell any securities, franchises, or other financial instruments, particularly in jurisdictions where such activity would be unlawful.
All content is of a general nature and may not address the specific circumstances of any individual or entity. It is not a substitute for professional advice or services. Any actions you take based on the information provided here are strictly at your own risk. You accept full responsibility for any decisions or outcomes arising from your use of this website and agree to release us from any liability in connection with your use of, or reliance upon, the content or products found herein.