
|
Valoración DCF de The Hackett Group, Inc. (HCKT) |
Completamente Editable: Adáptelo A Sus Necesidades En Excel O Sheets
Diseño Profesional: Plantillas Confiables Y Estándares De La Industria
Predeterminadas Para Un Uso Rápido Y Eficiente
Compatible con MAC / PC, completamente desbloqueado
No Se Necesita Experiencia; Fáciles De Seguir
The Hackett Group, Inc. (HCKT) Bundle
¡Descubra el verdadero valor de Hackett Group, Inc. (HCKT) con nuestra calculadora DCF de grado profesional! Ajuste los supuestos clave, explore varios escenarios y evalúe cómo los cambios influyen en la valoración de Hackett Group, Inc. (HCKT), todo dentro de una sola plantilla de Excel.
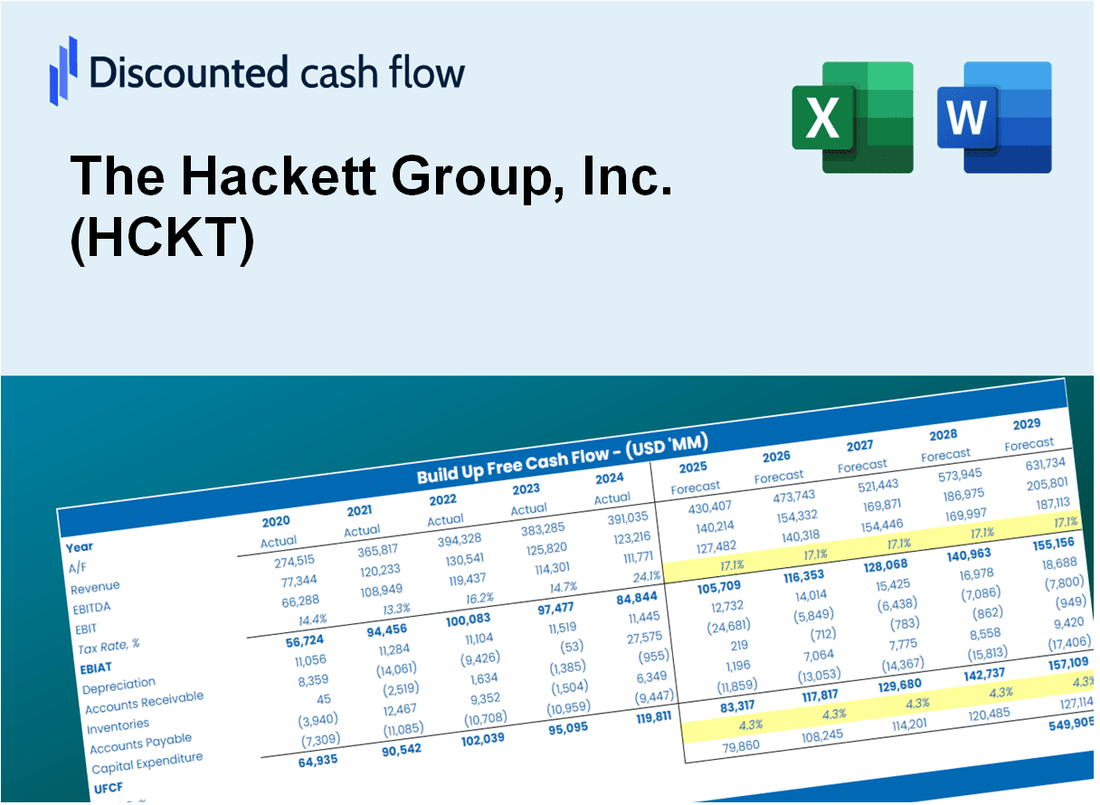
Discounted Cash Flow (DCF) - (USD MM)
| Year | AY1 2020 |
AY2 2021 |
AY3 2022 |
AY4 2023 |
AY5 2024 |
FY1 2025 |
FY2 2026 |
FY3 2027 |
FY4 2028 |
FY5 2029 |
|---|---|---|---|---|---|---|---|---|---|---|
| Revenue | 239.5 | 278.8 | 293.7 | 296.6 | 313.9 | 336.3 | 360.3 | 386.0 | 413.6 | 443.1 |
| Revenue Growth, % | 0 | 16.42 | 5.36 | 0.96956 | 5.82 | 7.14 | 7.14 | 7.14 | 7.14 | 7.14 |
| EBITDA | 13.1 | 50.9 | 58.7 | 52.7 | 48.5 | 51.7 | 55.4 | 59.4 | 63.6 | 68.2 |
| EBITDA, % | 5.48 | 18.24 | 19.98 | 17.76 | 15.45 | 15.38 | 15.38 | 15.38 | 15.38 | 15.38 |
| Depreciation | 4.5 | 4.4 | 3.4 | 3.4 | 3.9 | 4.7 | 5.1 | 5.4 | 5.8 | 6.2 |
| Depreciation, % | 1.87 | 1.57 | 1.17 | 1.15 | 1.25 | 1.4 | 1.4 | 1.4 | 1.4 | 1.4 |
| EBIT | 8.6 | 46.5 | 55.2 | 49.3 | 44.6 | 47.0 | 50.4 | 54.0 | 57.8 | 62.0 |
| EBIT, % | 3.61 | 16.67 | 18.81 | 16.61 | 14.21 | 13.98 | 13.98 | 13.98 | 13.98 | 13.98 |
| Total Cash | 49.5 | 45.8 | 30.3 | 21.0 | 16.4 | 40.1 | 43.0 | 46.1 | 49.3 | 52.9 |
| Total Cash, percent | .0 | .0 | .0 | .0 | .0 | .0 | .0 | .0 | .0 | .0 |
| Account Receivables | 32.8 | 50.6 | 48.4 | 52.1 | 57.1 | 56.5 | 60.6 | 64.9 | 69.5 | 74.5 |
| Account Receivables, % | 13.69 | 18.15 | 16.47 | 17.57 | 18.19 | 16.81 | 16.81 | 16.81 | 16.81 | 16.81 |
| Inventories | .0 | .0 | .0 | .0 | .0 | .0 | .0 | .0 | .0 | .0 |
| Inventories, % | 0 | 0 | 0 | 0 | 0 | 0 | 0 | 0 | 0 | 0 |
| Accounts Payable | 6.1 | 7.7 | 8.7 | 7.6 | 6.5 | 8.7 | 9.3 | 10.0 | 10.7 | 11.4 |
| Accounts Payable, % | 2.55 | 2.75 | 2.98 | 2.55 | 2.07 | 2.58 | 2.58 | 2.58 | 2.58 | 2.58 |
| Capital Expenditure | -1.9 | -3.2 | -4.7 | -4.1 | -4.1 | -4.2 | -4.5 | -4.8 | -5.1 | -5.5 |
| Capital Expenditure, % | -0.79046 | -1.16 | -1.59 | -1.38 | -1.3 | -1.24 | -1.24 | -1.24 | -1.24 | -1.24 |
| Tax Rate, % | 31.08 | 31.08 | 31.08 | 31.08 | 31.08 | 31.08 | 31.08 | 31.08 | 31.08 | 31.08 |
| EBITAT | 5.6 | 41.6 | 40.9 | 36.6 | 30.7 | 34.9 | 37.4 | 40.0 | 42.9 | 46.0 |
| Depreciation | ||||||||||
| Changes in Account Receivables | ||||||||||
| Changes in Inventories | ||||||||||
| Changes in Accounts Payable | ||||||||||
| Capital Expenditure | ||||||||||
| UFCF | -18.5 | 26.5 | 43.0 | 31.0 | 24.5 | 38.1 | 34.5 | 37.0 | 39.6 | 42.5 |
| WACC, % | 8.28 | 8.36 | 8.31 | 8.31 | 8.3 | 8.31 | 8.31 | 8.31 | 8.31 | 8.31 |
| PV UFCF | ||||||||||
| SUM PV UFCF | 151.0 | |||||||||
| Long Term Growth Rate, % | 3.00 | |||||||||
| Free cash flow (T + 1) | 44 | |||||||||
| Terminal Value | 823 | |||||||||
| Present Terminal Value | 552 | |||||||||
| Enterprise Value | 703 | |||||||||
| Net Debt | -1 | |||||||||
| Equity Value | 704 | |||||||||
| Diluted Shares Outstanding, MM | 28 | |||||||||
| Equity Value Per Share | 25.06 |
What You Will Get
- Comprehensive HCKT Financials: Access historical data and projections for precise valuation.
- Customizable Inputs: Adjust WACC, tax rates, revenue growth, and capital expenditures as needed.
- Dynamic Calculations: Intrinsic value and NPV are computed in real-time.
- Scenario Analysis: Explore various scenarios to assess The Hackett Group’s future performance.
- User-Friendly Interface: Designed for professionals while remaining approachable for newcomers.
Key Features
- Comprehensive HCKT Data: Pre-filled with The Hackett Group’s historical performance metrics and future projections.
- Flexible Input Options: Modify revenue growth rates, profit margins, discount rates, tax implications, and capital investments.
- Adaptive Valuation Framework: Instant updates to Net Present Value (NPV) and intrinsic valuation based on customized inputs.
- Scenario Analysis: Develop various forecasting scenarios to evaluate different valuation possibilities.
- Intuitive User Interface: Designed for ease of use, catering to both industry experts and newcomers.
How It Works
- Step 1: Download the prebuilt Excel template with The Hackett Group, Inc.'s (HCKT) data included.
- Step 2: Explore the pre-filled sheets and familiarize yourself with the key performance indicators.
- Step 3: Update forecasts and assumptions in the editable yellow cells (WACC, growth rates, profit margins).
- Step 4: Instantly view recalculated results, including The Hackett Group, Inc.'s (HCKT) intrinsic value.
- Step 5: Make informed investment decisions or generate reports based on the outputs.
Why Choose The Hackett Group, Inc. (HCKT)?
- Expertise: Leverage insights from industry leaders to drive performance.
- Customizable Solutions: Tailored services to meet the unique needs of your business.
- Efficiency: Streamlined processes to enhance productivity and reduce costs.
- Data-Driven: Utilize robust analytics for informed decision-making.
- Accessible: User-friendly interfaces designed for all levels of expertise.
Who Should Use This Product?
- Corporate Executives: Gain insights into operational efficiency and strategic planning for their organizations.
- Consultants: Provide clients with data-driven recommendations to enhance performance and reduce costs.
- Investors: Analyze market trends and make informed decisions regarding investments in The Hackett Group, Inc. (HCKT).
- Business Analysts: Leverage benchmarking data to identify improvement opportunities and measure success.
- Students: Explore business performance metrics and consulting methodologies in a real-world context.
What the Template Contains
- Preloaded HCKT Data: Historical and projected financial data, including revenue, EBIT, and capital expenditures.
- DCF and WACC Models: Professional-grade sheets for calculating intrinsic value and Weighted Average Cost of Capital.
- Editable Inputs: Yellow-highlighted cells for adjusting revenue growth, tax rates, and discount rates.
- Financial Statements: Comprehensive annual and quarterly financials for deeper analysis.
- Key Ratios: Profitability, leverage, and efficiency ratios to evaluate performance.
- Dashboard and Charts: Visual summaries of valuation outcomes and assumptions.
Disclaimer
All information, articles, and product details provided on this website are for general informational and educational purposes only. We do not claim any ownership over, nor do we intend to infringe upon, any trademarks, copyrights, logos, brand names, or other intellectual property mentioned or depicted on this site. Such intellectual property remains the property of its respective owners, and any references here are made solely for identification or informational purposes, without implying any affiliation, endorsement, or partnership.
We make no representations or warranties, express or implied, regarding the accuracy, completeness, or suitability of any content or products presented. Nothing on this website should be construed as legal, tax, investment, financial, medical, or other professional advice. In addition, no part of this site—including articles or product references—constitutes a solicitation, recommendation, endorsement, advertisement, or offer to buy or sell any securities, franchises, or other financial instruments, particularly in jurisdictions where such activity would be unlawful.
All content is of a general nature and may not address the specific circumstances of any individual or entity. It is not a substitute for professional advice or services. Any actions you take based on the information provided here are strictly at your own risk. You accept full responsibility for any decisions or outcomes arising from your use of this website and agree to release us from any liability in connection with your use of, or reliance upon, the content or products found herein.