
|
Valoración DCF de HUTCHMED (China) Limited (HCM) |
Completamente Editable: Adáptelo A Sus Necesidades En Excel O Sheets
Diseño Profesional: Plantillas Confiables Y Estándares De La Industria
Predeterminadas Para Un Uso Rápido Y Eficiente
Compatible con MAC / PC, completamente desbloqueado
No Se Necesita Experiencia; Fáciles De Seguir
HUTCHMED (China) Limited (HCM) Bundle
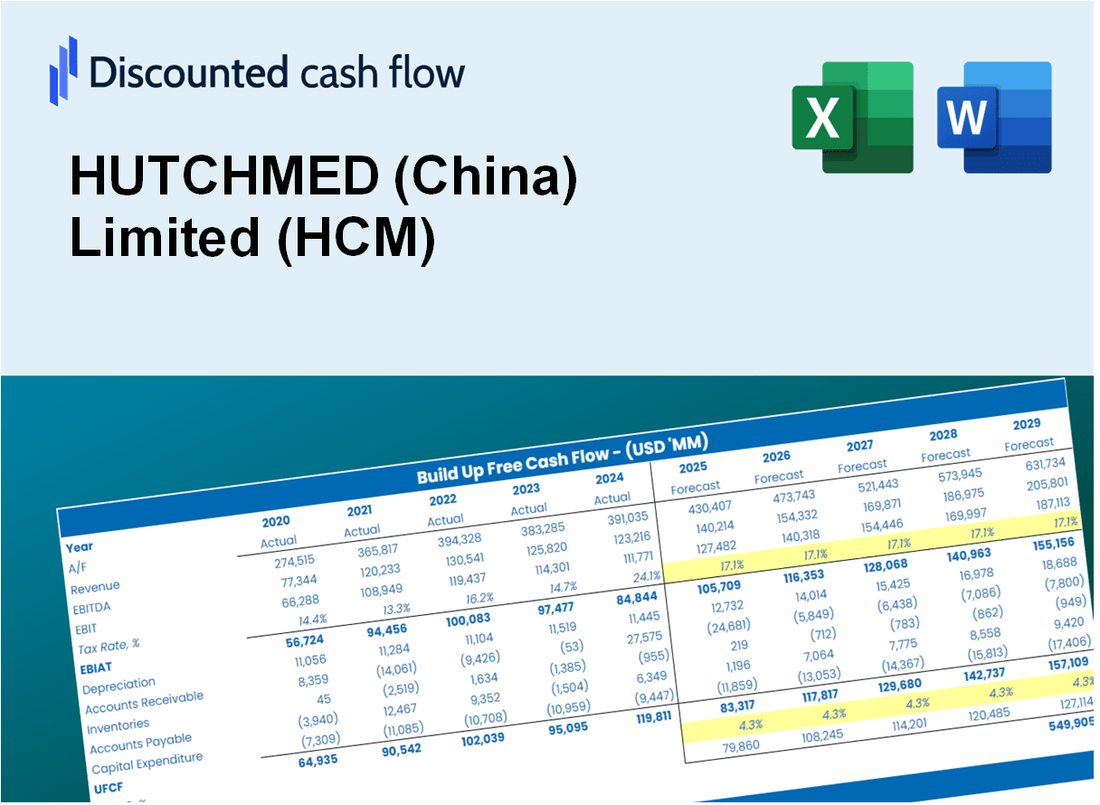
¡Simplifique la valoración de Hutchmed (China) Limited (HCM) con esta calculadora DCF personalizable! Con las finanzas de Real Hutchmed (China) Limited (HCM) y las entradas de pronóstico ajustables, puede probar escenarios y descubrir el valor razonable de Hutchmed (China) Limited (HCM) en minutos.
Discounted Cash Flow (DCF) - (USD MM)
| Year | AY1 2020 |
AY2 2021 |
AY3 2022 |
AY4 2023 |
AY5 2024 |
FY1 2025 |
FY2 2026 |
FY3 2027 |
FY4 2028 |
FY5 2029 |
|---|---|---|---|---|---|---|---|---|---|---|
| Revenue | 228.0 | 356.1 | 426.4 | 838.0 | 630.2 | 862.9 | 1,181.4 | 1,617.6 | 2,214.8 | 3,032.5 |
| Revenue Growth, % | 0 | 56.21 | 19.73 | 96.52 | -24.8 | 36.92 | 36.92 | 36.92 | 36.92 | 36.92 |
| EBITDA | -182.9 | -208.0 | -401.1 | 67.3 | 14.1 | -383.8 | -525.5 | -719.6 | -985.2 | -1,348.9 |
| EBITDA, % | -80.22 | -58.39 | -94.07 | 8.03 | 2.24 | -44.48 | -44.48 | -44.48 | -44.48 | -44.48 |
| Depreciation | 6.1 | 7.2 | 8.7 | 8.2 | 12.3 | 16.6 | 22.8 | 31.2 | 42.7 | 58.5 |
| Depreciation, % | 2.66 | 2.02 | 2.03 | 0.97936 | 1.96 | 1.93 | 1.93 | 1.93 | 1.93 | 1.93 |
| EBIT | -188.9 | -215.1 | -409.8 | 59.1 | 1.8 | -400.5 | -548.3 | -750.8 | -1,027.9 | -1,407.4 |
| EBIT, % | -82.88 | -60.41 | -96.1 | 7.05 | 0.28007 | -46.41 | -46.41 | -46.41 | -46.41 | -46.41 |
| Total Cash | 435.2 | 1,011.7 | 631.0 | 886.3 | 836.1 | 862.9 | 1,181.4 | 1,617.6 | 2,214.8 | 3,032.5 |
| Total Cash, percent | .0 | .0 | .0 | .0 | .0 | .0 | .0 | .0 | .0 | .0 |
| Account Receivables | 47.9 | 147.7 | 126.7 | 150.5 | 167.7 | 236.0 | 323.2 | 442.5 | 605.8 | 829.5 |
| Account Receivables, % | 21 | 41.48 | 29.72 | 17.95 | 26.62 | 27.35 | 27.35 | 27.35 | 27.35 | 27.35 |
| Inventories | 19.8 | 35.8 | 56.7 | 50.3 | 50.4 | 79.4 | 108.7 | 148.8 | 203.8 | 279.0 |
| Inventories, % | 8.67 | 10.04 | 13.29 | 6 | 8 | 9.2 | 9.2 | 9.2 | 9.2 | 9.2 |
| Accounts Payable | 31.6 | 41.2 | 71.1 | 36.3 | 42.5 | 91.8 | 125.7 | 172.1 | 235.6 | 322.6 |
| Accounts Payable, % | 13.87 | 11.56 | 16.68 | 4.33 | 6.75 | 10.64 | 10.64 | 10.64 | 10.64 | 10.64 |
| Capital Expenditure | -19.6 | -16.8 | -36.7 | -32.6 | -17.9 | -49.4 | -67.6 | -92.6 | -126.8 | -173.6 |
| Capital Expenditure, % | -8.59 | -4.71 | -8.6 | -3.89 | -2.85 | -5.73 | -5.73 | -5.73 | -5.73 | -5.73 |
| Tax Rate, % | 16.83 | 16.83 | 16.83 | 16.83 | 16.83 | 16.83 | 16.83 | 16.83 | 16.83 | 16.83 |
| EBITAT | -214.3 | -269.6 | -410.4 | 56.4 | 1.5 | -383.3 | -524.9 | -718.6 | -984.0 | -1,347.2 |
| Depreciation | ||||||||||
| Changes in Account Receivables | ||||||||||
| Changes in Inventories | ||||||||||
| Changes in Accounts Payable | ||||||||||
| Capital Expenditure | ||||||||||
| UFCF | -263.8 | -385.5 | -408.4 | -20.1 | -15.4 | -464.1 | -652.3 | -893.1 | -1,222.8 | -1,674.3 |
| WACC, % | 5.8 | 5.8 | 5.8 | 5.78 | 5.71 | 5.78 | 5.78 | 5.78 | 5.78 | 5.78 |
| PV UFCF | ||||||||||
| SUM PV UFCF | -4,017.4 | |||||||||
| Long Term Growth Rate, % | 2.00 | |||||||||
| Free cash flow (T + 1) | -1,708 | |||||||||
| Terminal Value | -45,213 | |||||||||
| Present Terminal Value | -34,143 | |||||||||
| Enterprise Value | -38,161 | |||||||||
| Net Debt | -64 | |||||||||
| Equity Value | -38,097 | |||||||||
| Diluted Shares Outstanding, MM | 35 | |||||||||
| Equity Value Per Share | -1,091.19 |
What You Will Get
- Editable Forecast Inputs: Effortlessly adjust assumptions (growth %, margins, WACC) to explore various scenarios.
- Real-World Data: HUTCHMED (China) Limited’s financial data pre-loaded to enhance your analysis.
- Automatic DCF Outputs: The template computes Net Present Value (NPV) and intrinsic value automatically.
- Customizable and Professional: A refined Excel model tailored to meet your valuation requirements.
- Built for Analysts and Investors: Perfect for evaluating projections, confirming strategies, and optimizing efficiency.
Key Features
- Comprehensive HCM Data: Pre-loaded with HUTCHMED's historical performance metrics and future outlooks.
- Customizable Financial Assumptions: Tailor revenue growth rates, profit margins, discount rates, tax assumptions, and capital investments.
- Interactive Valuation Framework: Real-time adjustments to Net Present Value (NPV) and intrinsic value reflecting your financial inputs.
- Multiple Scenario Analysis: Develop various forecasting scenarios to evaluate different valuation results.
- Intuitive User Interface: Designed for ease of use, catering to both seasoned professionals and newcomers.
How It Works
- Step 1: Download the Excel file.
- Step 2: Review pre-entered HUTCHMED (China) Limited (HCM) data (historical and projected).
- Step 3: Adjust key assumptions (yellow cells) based on your analysis.
- Step 4: View automatic recalculations for HUTCHMED (China) Limited (HCM)’s intrinsic value.
- Step 5: Use the outputs for investment decisions or reporting.
Why Choose This Calculator for HUTCHMED (China) Limited (HCM)?
- All-in-One Solution: Features DCF, WACC, and financial ratio analyses tailored for HUTCHMED (HCM).
- Flexible Inputs: Modify the highlighted cells to explore different financial scenarios.
- In-Depth Analysis: Automatically computes HUTCHMED's intrinsic value and Net Present Value.
- Preloaded Information: Historical and projected data provide reliable benchmarks.
- Expert-Level Tool: Perfect for financial analysts, investors, and business advisors focusing on HUTCHMED (HCM).
Who Should Use This Product?
- Investors: Accurately assess HUTCHMED (China) Limited’s [HCM] fair value before making investment decisions.
- CFOs: Utilize a professional-grade DCF model for comprehensive financial reporting and analysis of HUTCHMED (China) Limited [HCM].
- Consultants: Easily customize the template for valuation reports tailored to HUTCHMED (China) Limited [HCM] clients.
- Entrepreneurs: Acquire insights into the financial modeling techniques employed by leading pharmaceutical companies like HUTCHMED (China) Limited [HCM].
- Educators: Implement it as a teaching resource to illustrate valuation methodologies relevant to HUTCHMED (China) Limited [HCM].
What the Template Contains
- Pre-Filled DCF Model: HUTCHMED (China) Limited’s financial data preloaded for immediate use.
- WACC Calculator: Detailed calculations for Weighted Average Cost of Capital.
- Financial Ratios: Evaluate HUTCHMED (China) Limited’s profitability, leverage, and efficiency.
- Editable Inputs: Change assumptions such as growth, margins, and CAPEX to fit your scenarios.
- Financial Statements: Annual and quarterly reports to support detailed analysis.
- Interactive Dashboard: Easily visualize key valuation metrics and results.
Disclaimer
All information, articles, and product details provided on this website are for general informational and educational purposes only. We do not claim any ownership over, nor do we intend to infringe upon, any trademarks, copyrights, logos, brand names, or other intellectual property mentioned or depicted on this site. Such intellectual property remains the property of its respective owners, and any references here are made solely for identification or informational purposes, without implying any affiliation, endorsement, or partnership.
We make no representations or warranties, express or implied, regarding the accuracy, completeness, or suitability of any content or products presented. Nothing on this website should be construed as legal, tax, investment, financial, medical, or other professional advice. In addition, no part of this site—including articles or product references—constitutes a solicitation, recommendation, endorsement, advertisement, or offer to buy or sell any securities, franchises, or other financial instruments, particularly in jurisdictions where such activity would be unlawful.
All content is of a general nature and may not address the specific circumstances of any individual or entity. It is not a substitute for professional advice or services. Any actions you take based on the information provided here are strictly at your own risk. You accept full responsibility for any decisions or outcomes arising from your use of this website and agree to release us from any liability in connection with your use of, or reliance upon, the content or products found herein.